
Saudi Aramco’s Exports Hold, but War-Risk Costs Tell a Darker Story
Aug 17, 2026


Global seaborne petroleum product trade has contracted by an estimated 3.8 million barrels per day, according to the IEA’s August 2026 Oil Market Report. At any other moment in recent history, a supply loss of that magnitude would have collapsed refinery margins alongside it. Instead, Atlantic Basin refiners are posting the highest crack spreads ever recorded. The paradox resolves once the supply destruction is mapped: the barrels that disappeared were refined products, not crude, and they vanished from the two export sources that Europe and the U.S. East Coast depended on most. What follows is a breakdown of the specific records being set, the mechanics driving them, the investment implications across three distinct energy sectors, and the five variables that will determine how long this environment persists.
The IEA’s August 2026 Oil Market Report states explicitly that Atlantic Basin refining margins hit all-time highs in July 2026, with product cracks and margins continuing to set new records into August. The numbers behind that language are worth absorbing individually, because each one represents a distinct market breaking through its historical ceiling.
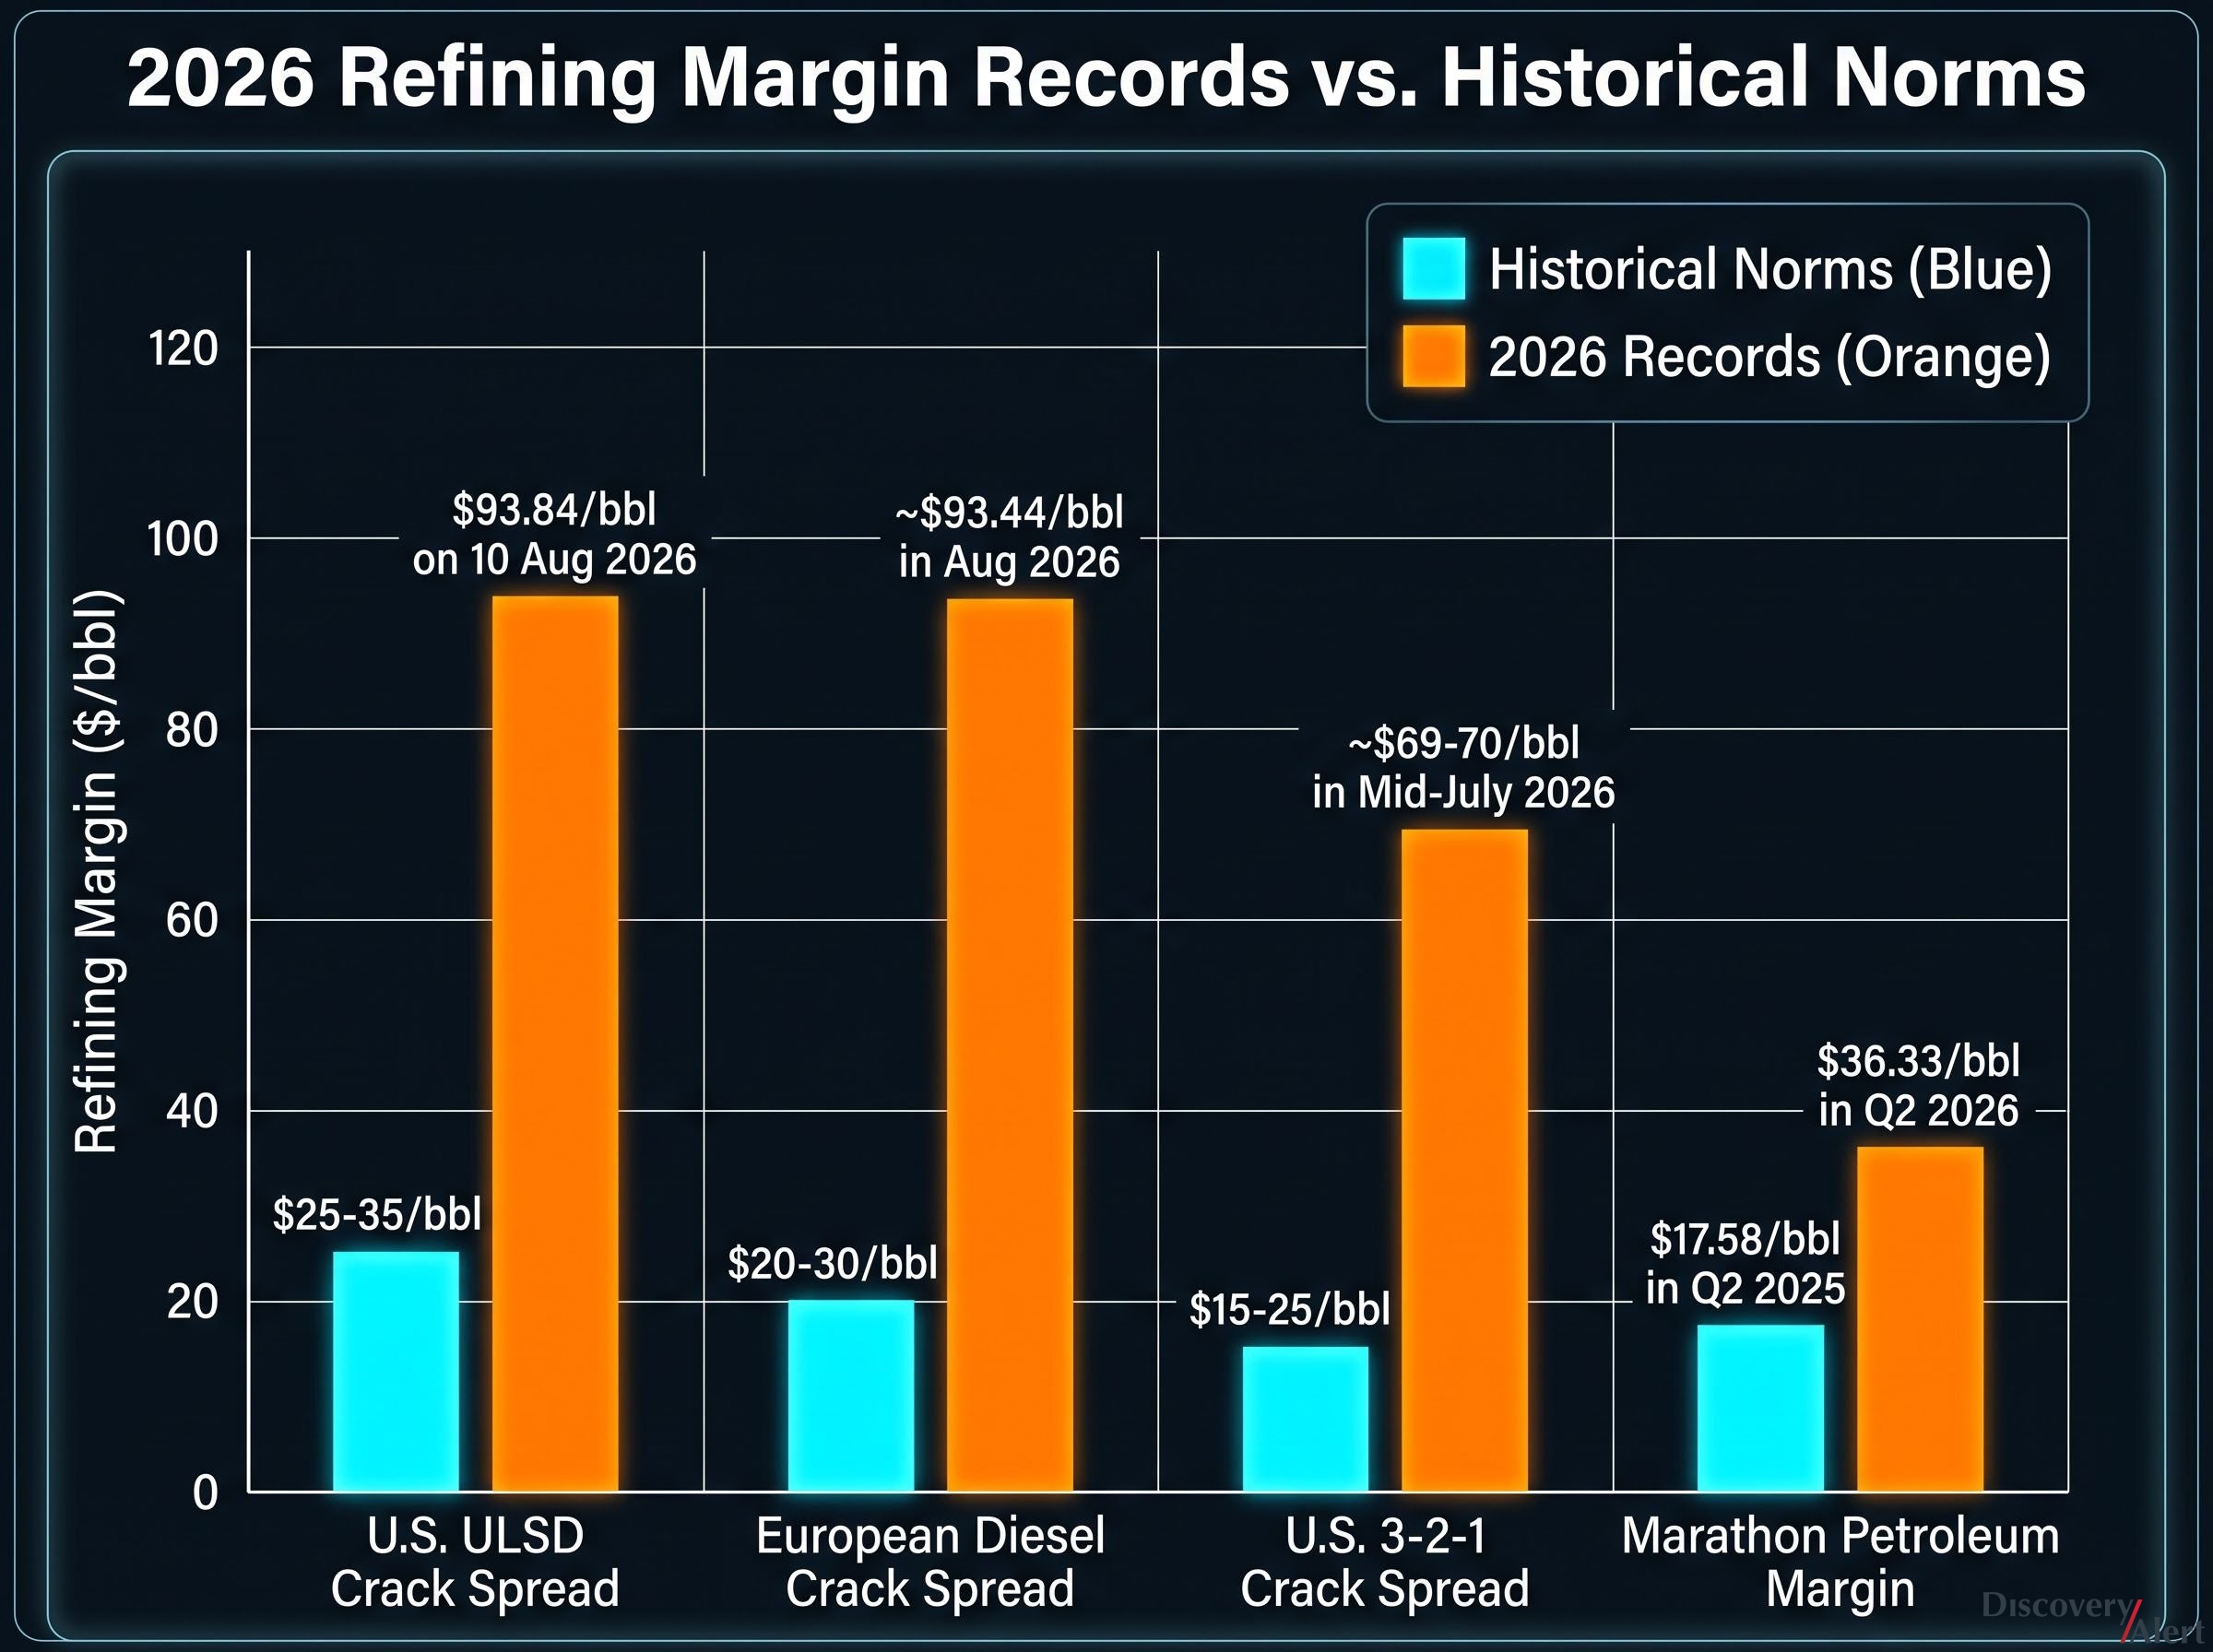
The IEA reports that increasingly tight product markets pushed Atlantic Basin refining margins to “all-time highs” in July, with diesel, jet fuel, and gasoline cracks surging. Product cracks and refining margins continued to rise into August, setting new records in Europe.
The U.S. ultra-low sulphur diesel (ULSD) crack spread reached $93.84 per barrel on 10 August. The European diesel crack hit approximately $93.44 per barrel. The benchmark U.S. 3-2-1 crack spread peaked at approximately $69-70 per barrel in mid-July, the highest level ever recorded. Marathon Petroleum reported a refining and marketing margin of $36.33 per barrel in Q2 2026, more than double the $17.58 per barrel it posted in Q2 2025.
These are not crude oil records. They are refined product records, and that distinction matters: diesel and jet fuel are driving this tightening, not the barrel going into the refinery but the barrel coming out.
The IEA Oil Market Report for August 2026 attributes the Atlantic Basin margin surge directly to tighter light and middle distillate markets, citing the simultaneous loss of Russian and Gulf export volumes as the structural driver behind crack spreads reaching levels with no historical precedent.
| Benchmark | Record Level | Date Set | Prior Norm (approx.) |
|---|---|---|---|
| U.S. ULSD crack spread | $93.84/bbl | 10 August 2026 | $25-35/bbl |
| European diesel crack spread | ~$93.44/bbl | August 2026 | $20-30/bbl |
| U.S. 3-2-1 crack spread | ~$69-70/bbl | Mid-July 2026 | $15-25/bbl |
| Marathon Petroleum margin | $36.33/bbl | Q2 2026 | $17.58/bbl (Q2 2025) |
Two supply shocks produced this deficit. Each one is serious on its own. Together, they have created a hole in global refined product trade too large for any single alternative supplier to fill.
The product trade contraction is inseparable from the routing disruptions created by dual chokepoints, the Strait of Hormuz and the sanctions-constrained corridors around Russia, each of which has redirected or eliminated flows that Atlantic Basin importers previously treated as reliable baseline supply.
Global refinery crude throughput reached 80.9 million bpd in July 2026, still approximately 5 million bpd below year-ago levels. Full-year 2026 throughput is projected to average roughly 2.5 million bpd below the prior year, according to the IEA.
Both shocks target the same product categories, diesel and jet fuel, that Atlantic Basin geographies have historically imported. Europe and the U.S. East Coast absorbed the sharpest impact precisely because their import dependence was heaviest on these two sources.
The price a driver pays at the pump contains two separate economics. One is the cost of crude oil. The other is the cost of turning that crude into usable fuel. The gap between those two, expressed per barrel, is the refining margin, and it determines whether refiners earn outsized profits or merely cover operating costs.
The industry benchmark for measuring this gap is the 3-2-1 crack spread:
In normal conditions, the U.S. 3-2-1 crack spread trades in a range of approximately $15-25 per barrel. In mid-July 2026, it reached approximately $69-70 per barrel, nearly three times the upper end of the historical mid-cycle norm.
That margin flows directly into refiner earnings, free cash flow, and the capital return programmes (buybacks, dividends) that drive equity valuations. Marathon Petroleum’s margin doubling from $17.58 to $36.33 per barrel in a single year illustrates the mechanism: crack spreads move, and refiner income moves with them in near real time. Investors who can read crack spread data do not need to wait for quarterly earnings to gauge refiner profitability.
U.S. fuel exports surged by approximately 700,000 bpd year-on-year in July 2026, a genuine and material response to the global product shortfall. Gulf Coast refiners possess the structural advantages this market rewards: heavy sour crude processing capability and distillate-rich output configurations that match precisely what the undersupplied Atlantic Basin needs. Marathon Petroleum, Valero, and Phillips 66 are the primary named beneficiaries.
The arithmetic, however, is blunt: 700,000 bpd of new U.S. exports against an estimated 3.8 million bpd contraction covers roughly 18% of the global product trade loss.
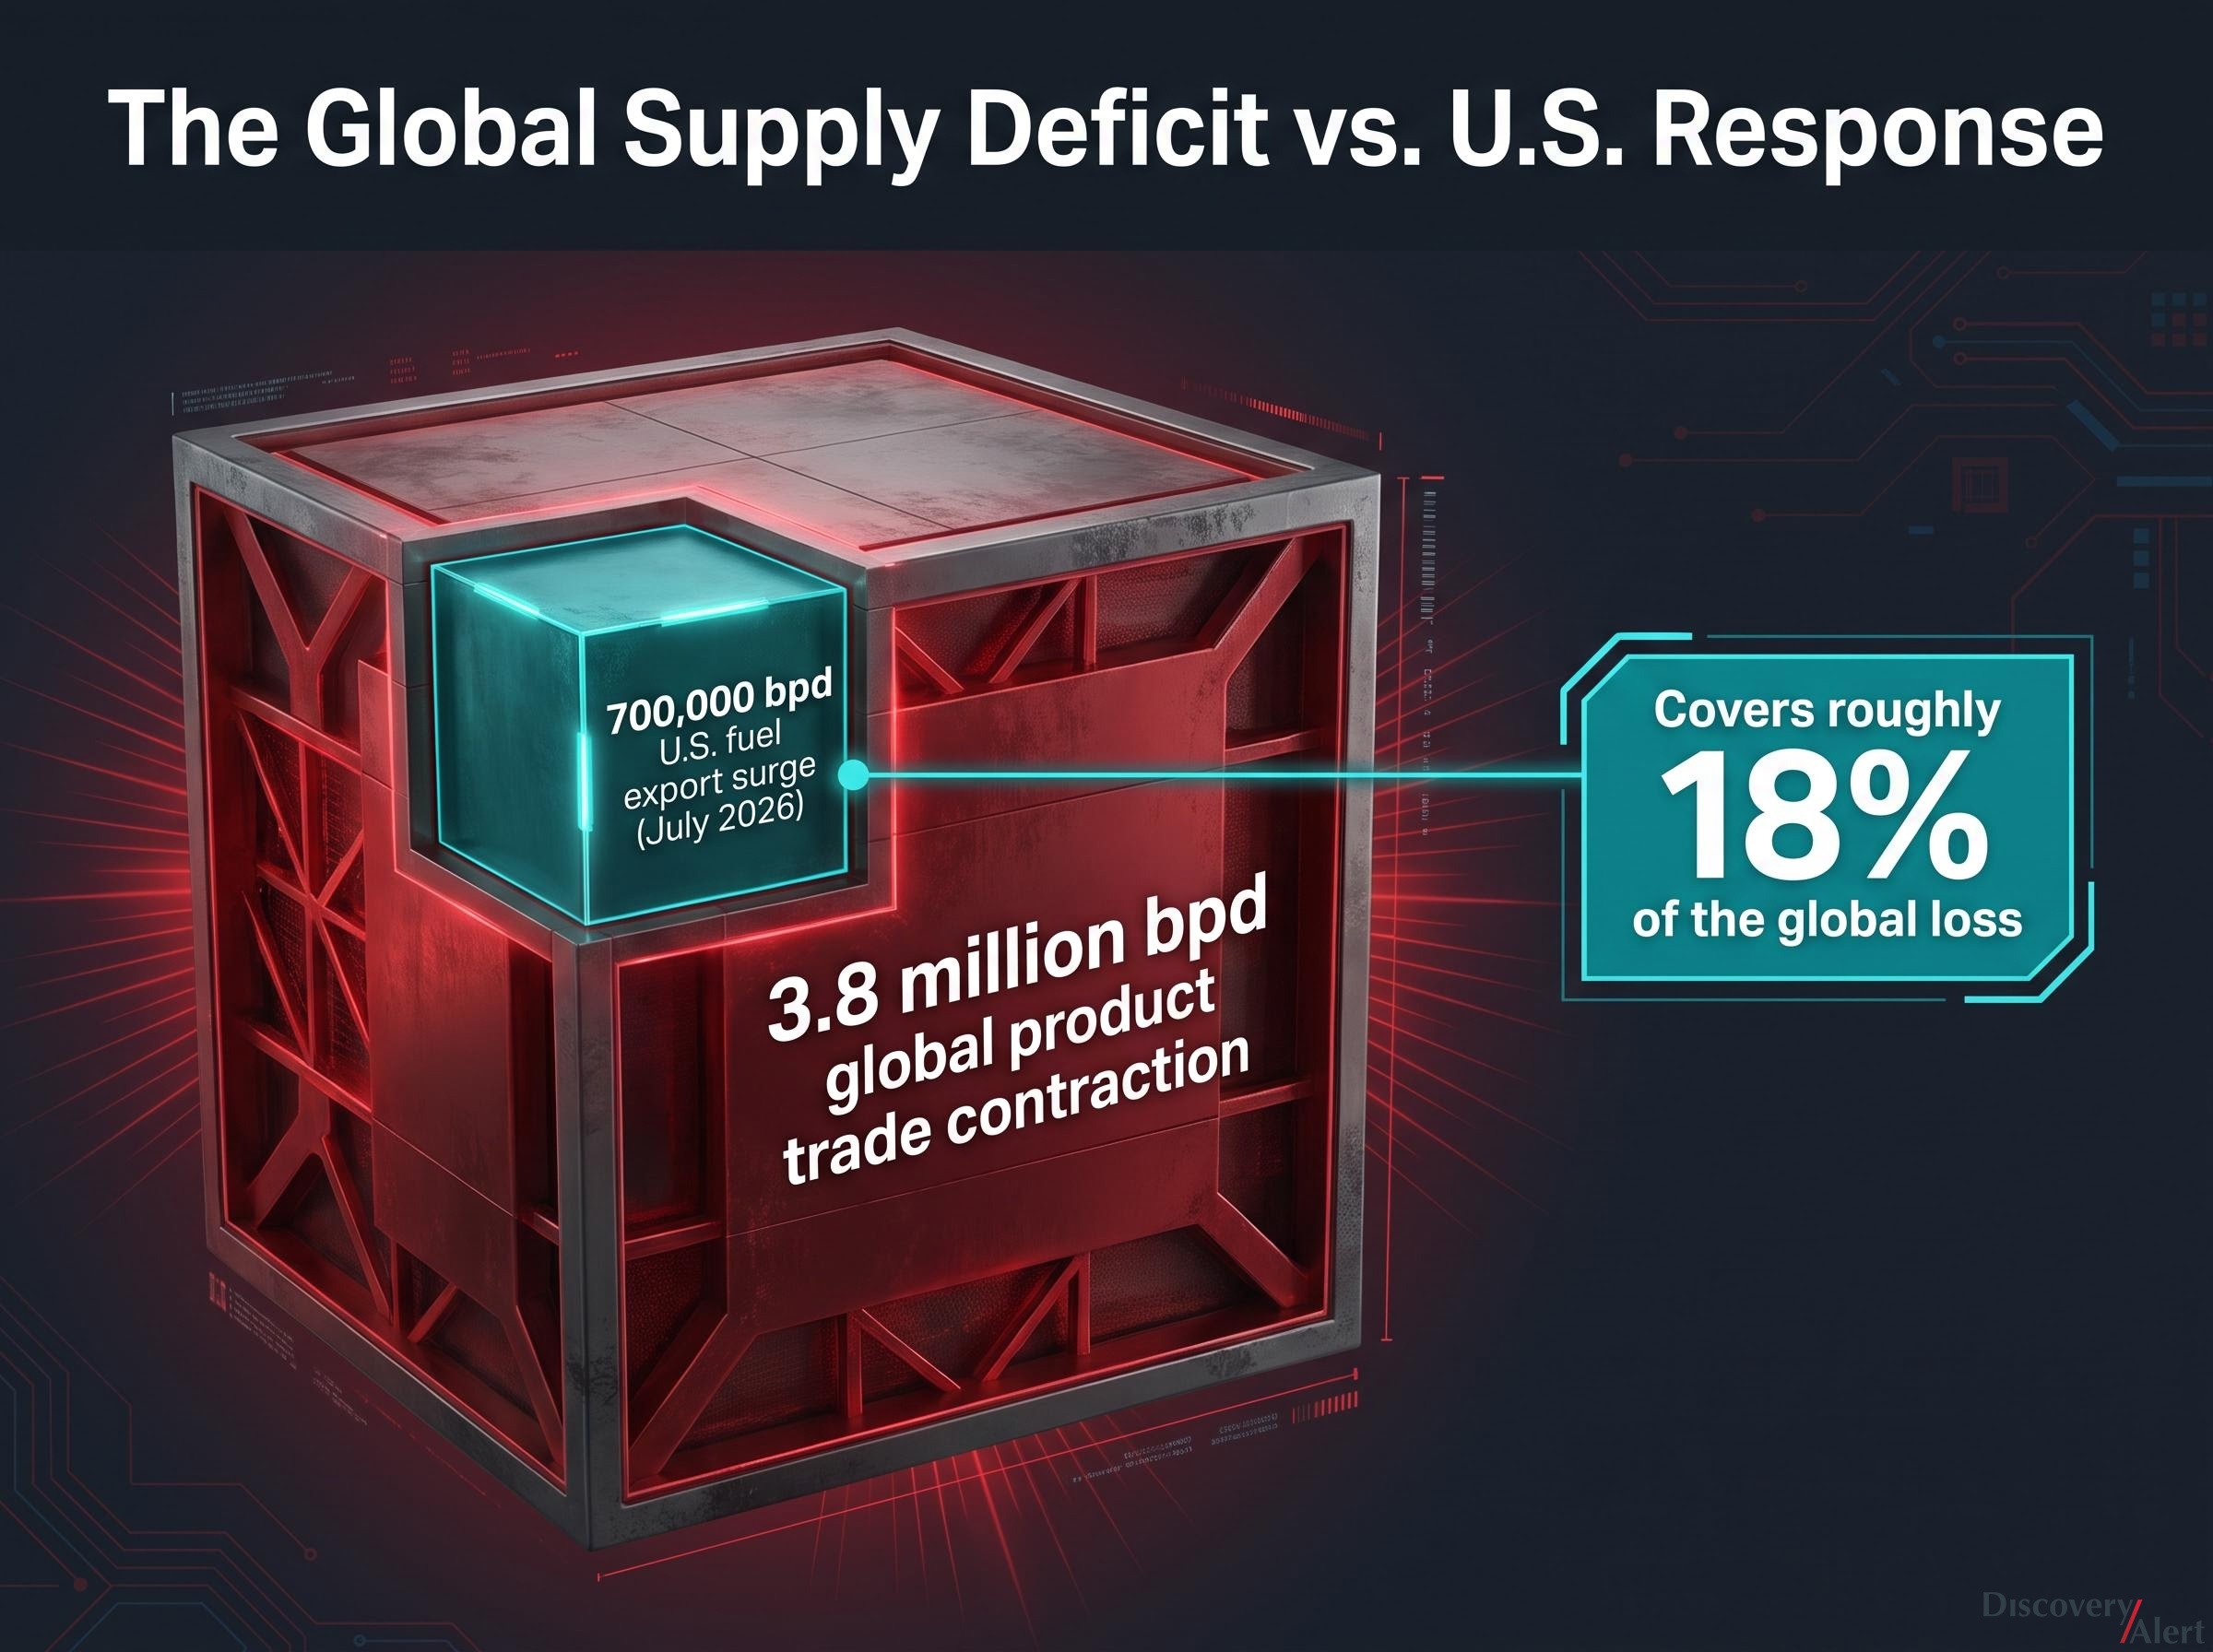
That gap is exactly why margins remain at records rather than mean-reverting. U.S. refiners are capitalising, but they cannot close the deficit alone.
U.S. energy vulnerability to refined product price shocks persists even at record domestic crude output levels, because the U.S. East Coast remains structurally dependent on imported diesel and the Gulf Coast export infrastructure is configured for outbound flows rather than inbound redistribution.
The export surge also creates a distinct investment angle through midstream operators. Companies with Gulf Coast terminals, export docks, and refined-product pipelines collect volume-driven fee income that persists as long as export volumes remain elevated:
The margin windfall is flowing through three distinct sectors, each with a different profit mechanism and a different risk profile.
| Sector | Key Beneficiaries | Profit Mechanism | Primary Risk |
|---|---|---|---|
| Pure-play refiners | Marathon Petroleum, Valero, Phillips 66 | Direct crack spread leverage; margins double when spreads double | Sharpest normalisation risk if geopolitical disruptions resolve |
| Midstream operators | Gulf Coast terminal and pipeline operators | Volume-driven fee income from elevated U.S. exports | Export volumes decline if global product trade rebalances |
| Integrated majors | ExxonMobil, Chevron | Strong downstream earnings offset by upstream complexity | Net impact varies by refining footprint and crude sourcing mix |
ExxonMobil posted its strongest downstream earnings since 2022 in Q2 2026. Chevron’s downstream earnings in the same quarter were the highest this decade. Both results are largely attributable to record diesel and refining margins.
The key risk runs through all three sectors. If Strait of Hormuz disruptions resolve and Russian export capacity recovers, the same mechanics that inflated margins will deflate them.
Energy sector valuations across North America remain fragmented despite the shared commodity backdrop: Canadian integrated producers are priced at deep discounts to U.S. pure-play refiners even as both benefit from the same elevated crack spread environment, reflecting pipeline and market-access constraints that are separate from the product margin story.
Elevated refining margins translate directly into high retail diesel, gasoline, and jet fuel prices. Sustained high fuel prices are the self-limiting mechanism for any refining margin windfall: they erode freight activity, curtail travel, and slow industrial production, compressing the demand base that supports the margins themselves.
This margin environment reflects a structural realignment of refined product trade that has been building since 2022. Whether “structural” means months or years depends on the pace of supply restoration. The IEA projects a 3.5 million bpd recovery in global refinery runs in 2027, but that forecast is conditional, not guaranteed.
Permanent closures of refining capacity in the U.S. and Europe have tightened the baseline supply-demand balance even before the current disruptions, which means any normalisation starts from a higher floor than the pre-2022 era.
A structural supply deficit in refined products operates differently from a crude oil shortage: even a peace deal that reopens the Strait of Hormuz would not immediately restore the refining capacity and export infrastructure that has been physically damaged or commercially isolated over the past four years.
Five variables will determine the trajectory:
The IEA’s 3.5 million bpd throughput recovery projection for 2027 represents the baseline normalisation scenario. Full realisation would substantially narrow the global product trade deficit, compressing Atlantic Basin crack spreads back toward, though likely not all the way to, pre-disruption norms. Investors pricing refining equities at current margin levels should treat this forecast as the scenario they need to underwrite or discount, because it defines the timeline on which the current windfall either persists or fades.
The estimated 3.8 million bpd contraction in global seaborne product trade is too large and too structurally embedded in geopolitical realities for U.S. export growth alone to resolve within months. Atlantic Basin crack spreads at $70-94 per barrel reflect a product market that has fundamentally re-priced around supply scarcity.
The sector hierarchy matters for positioning: pure-play refiners carry the highest reward and the sharpest normalisation risk; midstream offers duration through volume-driven fees; integrated majors offer exposure with upstream complexity. The five monitoring variables, supply restoration speed, new capacity timelines, demand elasticity, Hormuz trajectory, and the 2027 throughput recovery, are the specific signals that will indicate when the margin cycle is turning.
This article is for informational purposes only and should not be considered financial advice. Investors should conduct their own research and consult with financial professionals before making investment decisions. Past performance does not guarantee future results, and financial projections are subject to market conditions and various risk factors.
A crack spread measures the difference between the market value of refined products (such as gasoline and diesel) and the cost of the crude oil input used to produce them, expressed per barrel. It is the primary indicator of refinery profitability, and when crack spreads rise, refiner earnings, free cash flow, and capital return programmes rise with them in near real time.
The IEA's August 2026 Oil Market Report attributes the record Atlantic Basin refinery margins to a simultaneous loss of Russian diesel exports (due to sanctions and infrastructure damage) and Persian Gulf product exports (due to Strait of Hormuz disruptions), which together removed an estimated 3.8 million barrels per day from global seaborne product trade.
The 3-2-1 crack spread calculates the value of refining three barrels of crude oil into two barrels of gasoline and one barrel of diesel, then subtracts the crude input cost to express the refinery's gross margin per barrel. Historically trading at roughly $15-25 per barrel, the U.S. 3-2-1 crack spread peaked at approximately $69-70 per barrel in mid-July 2026, nearly three times the upper end of its historical norm.
Pure-play refiners with Gulf Coast heavy sour crude processing capability, particularly Marathon Petroleum, Valero, and Phillips 66, are the primary named beneficiaries, with Marathon reporting a refining margin of $36.33 per barrel in Q2 2026, more than double its Q2 2025 figure. ExxonMobil and Chevron also posted their strongest downstream earnings since 2022 and the highest this decade, respectively.
The five key variables are: the speed at which disrupted Russian and Gulf refining capacity is restored, the pace of new alternative refining capacity coming online in Asia and India, whether high fuel prices destroy demand faster than projected, the geopolitical trajectory in the Strait of Hormuz, and whether the IEA's projected 3.5 million bpd throughput recovery for 2027 materialises on schedule.


