
Saudi Aramco’s Exports Hold, but War-Risk Costs Tell a Darker Story
Aug 17, 2026


Spot gold broke above a $4,100-$4,200 congestion range that had capped the market for weeks in August, adding approximately $450 in a single move. Algorithmic systems triggered. Short-covering cascaded. Silver rose roughly $9.50 in parallel. Financial media attributed the breakout to Iran headlines and rate-cut expectations. The commodity trading advisors caught on the wrong side of it, and the central banks that bought into every dip, were responding to something older than any news cycle: a reconfiguration of how sovereign reserve managers store wealth, and who sets the price of physical gold.
This analysis separates the structural drivers from the noise, maps the institutional forecast landscape honestly (including where forecasts have been revised lower), and gives mining and energy investors a framework for positioning across a base case that runs through $6,000 and a crisis-extension scenario that reaches $8,000.
The technical facts are clean. Gold had compressed into a $4,100-$4,200 range for weeks, building energy beneath a ceiling that absorbed repeated tests. When the break came, the $450 rally was not gradual. It was a short-squeeze layered on top of algorithmic momentum, with commodity trading advisors (CTAs) caught heavily short and forced to cover into a thin August market.
The mainstream headline attribution, Iran and rate-cut expectations, was retrofitted noise. The actual positioning dynamic told a different story entirely.
CTAs had built bearish positions against gold in the weeks prior. The initial break forced covering. The covering triggered algorithmic systems. The result was a move that looked event-driven on the surface but was supply-driven underneath. Goldman Sachs commentary cited in Zero Hedge analysis pointed to this dynamic directly.
The structural floor sits below the headlines. Key technical levels now form a layered price map for institutional positioning:
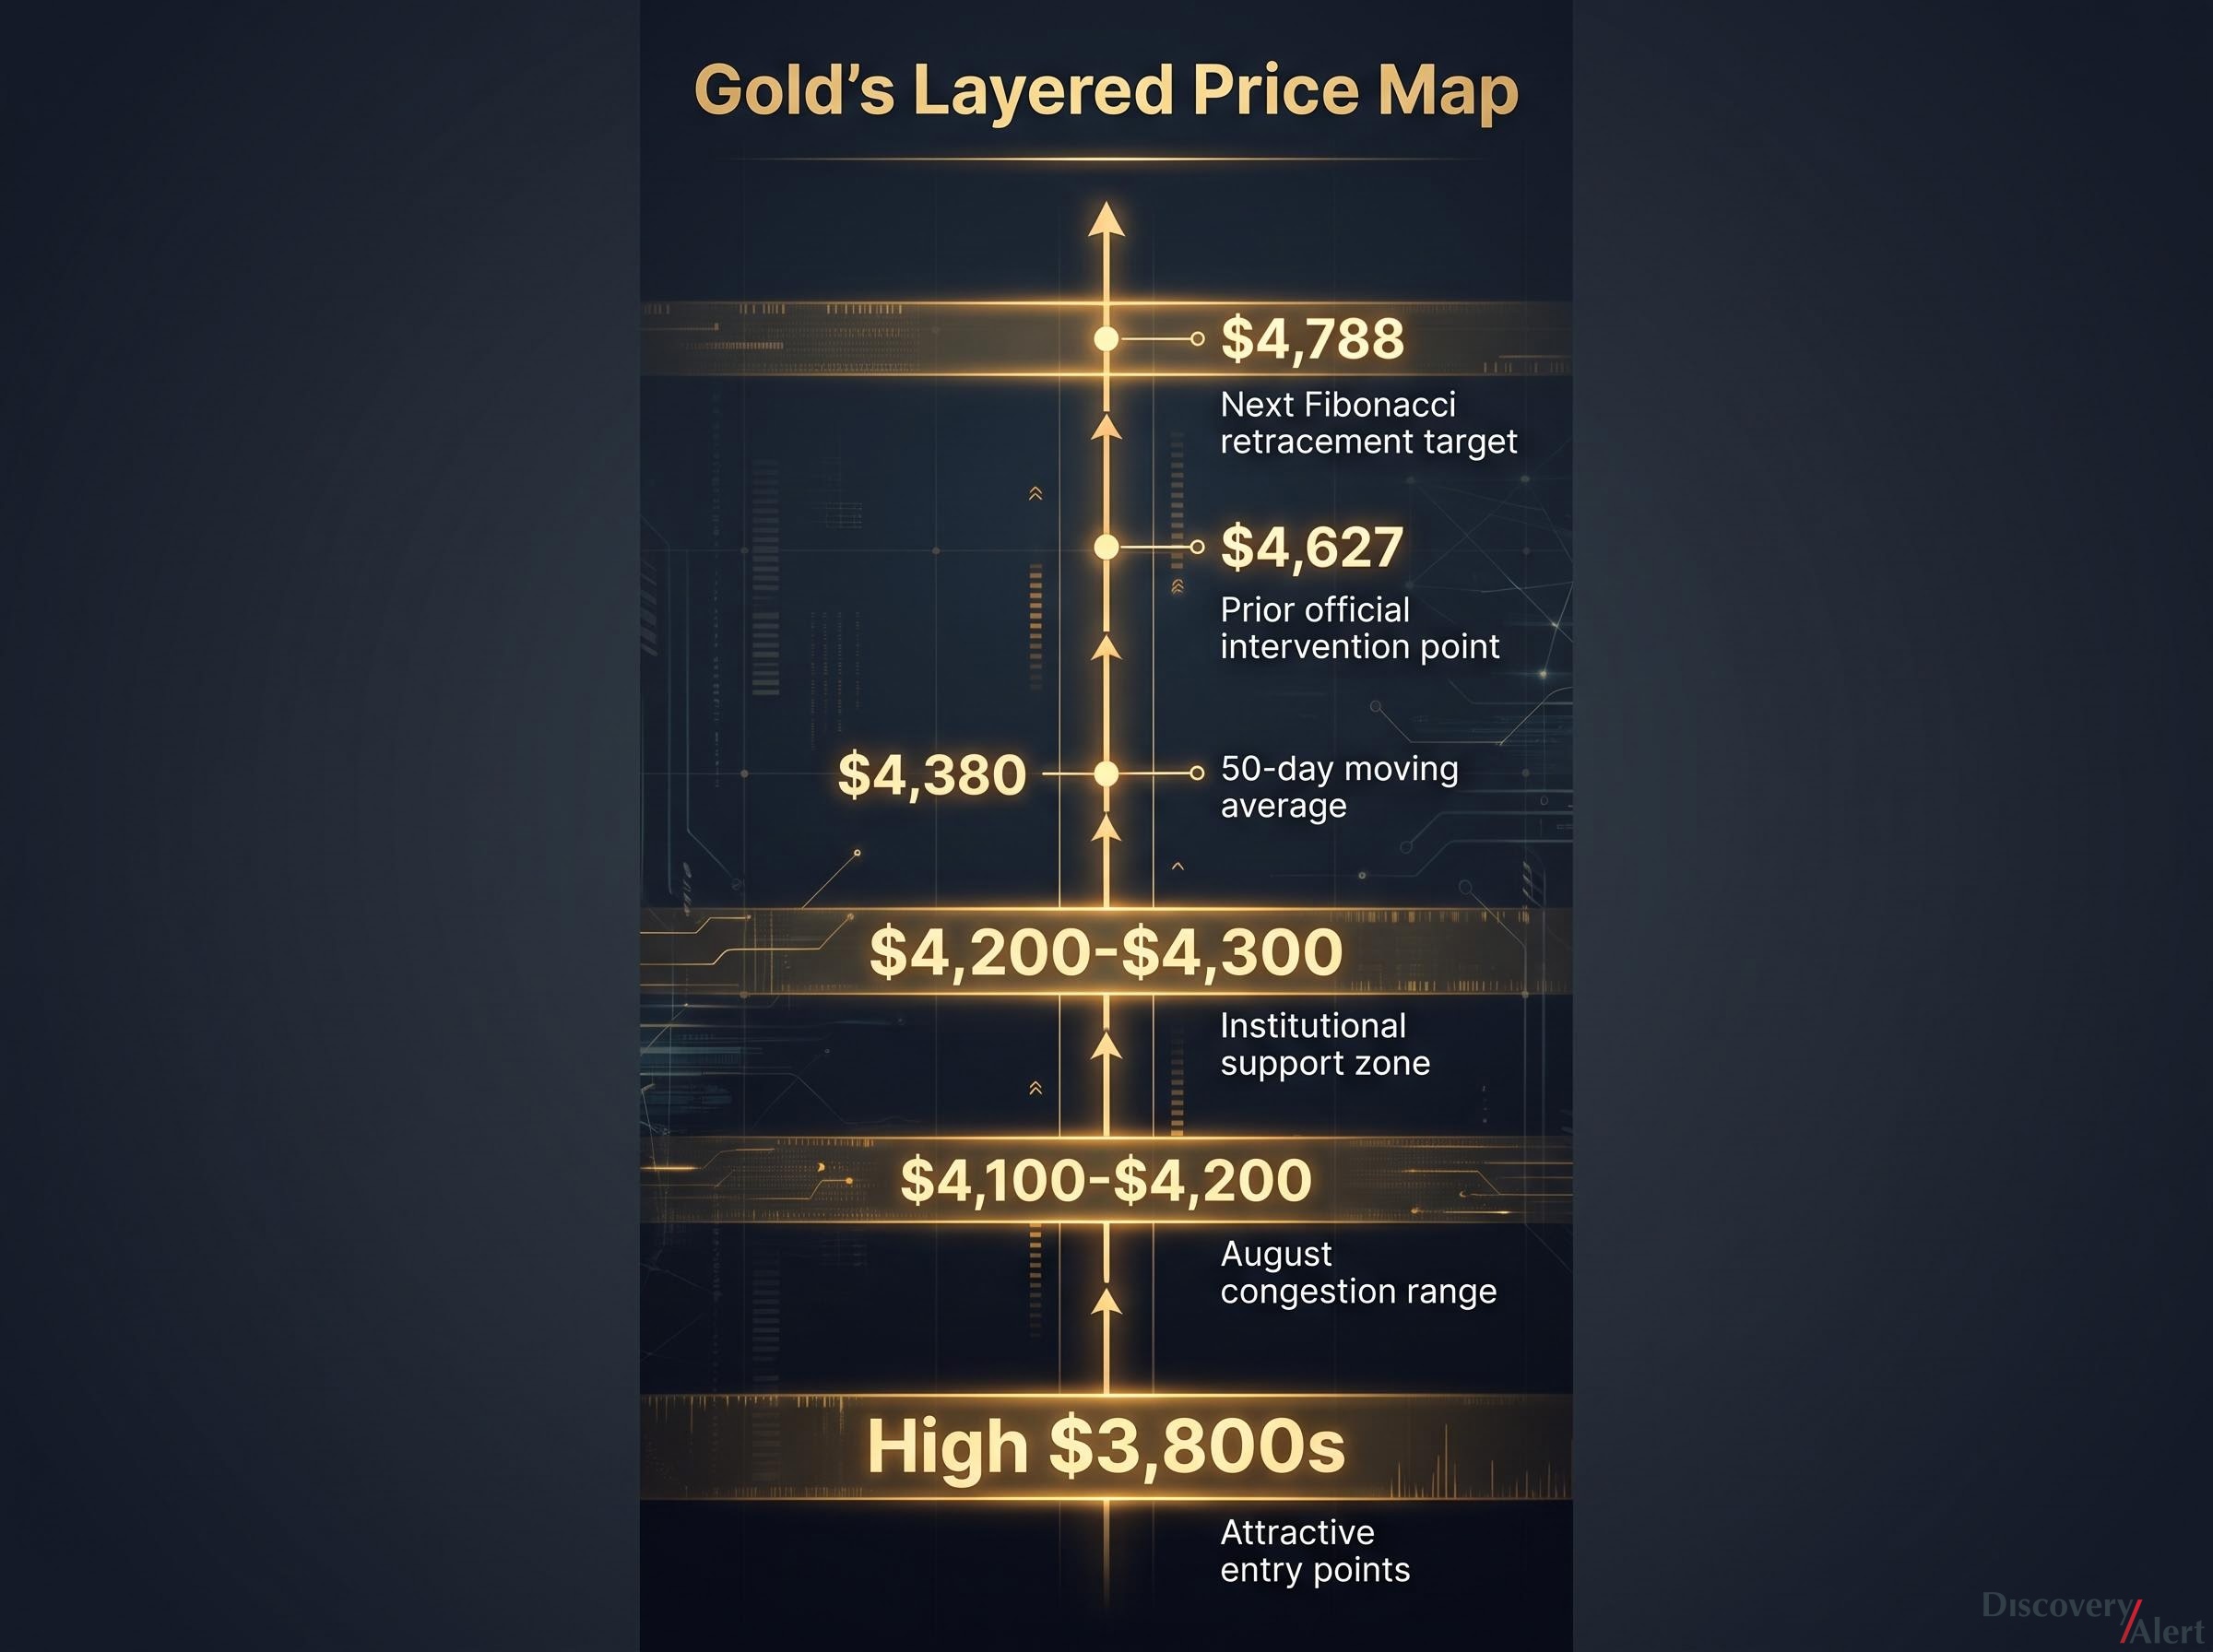
Global-facing first-tier liquidity providers have characterised dip levels toward the high $3,800s as attractive entry points. The signal from the August breakout was not the price level itself. It was the buyer composition beneath it, confirming that institutional and sovereign capital treats every pullback as an accumulation opportunity rather than a reason to reduce exposure.
Central banks bought 244 tonnes of gold in Q1 2026 alone. Bar and coin demand hit its second-highest level ever during the same period. When the price dipped, official buyers increased purchases rather than pulling back.
Accelerating central-bank demand has been most visible in quarterly purchase data, where the pace of accumulation has pushed into territory not seen in over a decade, with broad emerging-market participation supplementing the headline buyers.
Bank of America’s structural work quantifies the scale: central-bank reserve diversification is running above 1,000 tonnes per year, more than double the long-run average. This is not cyclical. It is a policy-driven structural bid from sovereign reserve managers who are actively reducing their exposure to dollar-denominated debt in favour of zero-counterparty-risk physical gold. Importantly, reported figures understate the total. Unreported monetary gold acquisitions are occurring beyond publicly disclosed volumes.
IMF analysis of gold in central bank reserves, published in August 2025, distinguishes between valuation-driven changes in gold’s reserve share and physical accumulation, a distinction that matters because it clarifies how much of the apparent surge in gold holdings reflects genuine sovereign buying rather than price appreciation on existing stocks.
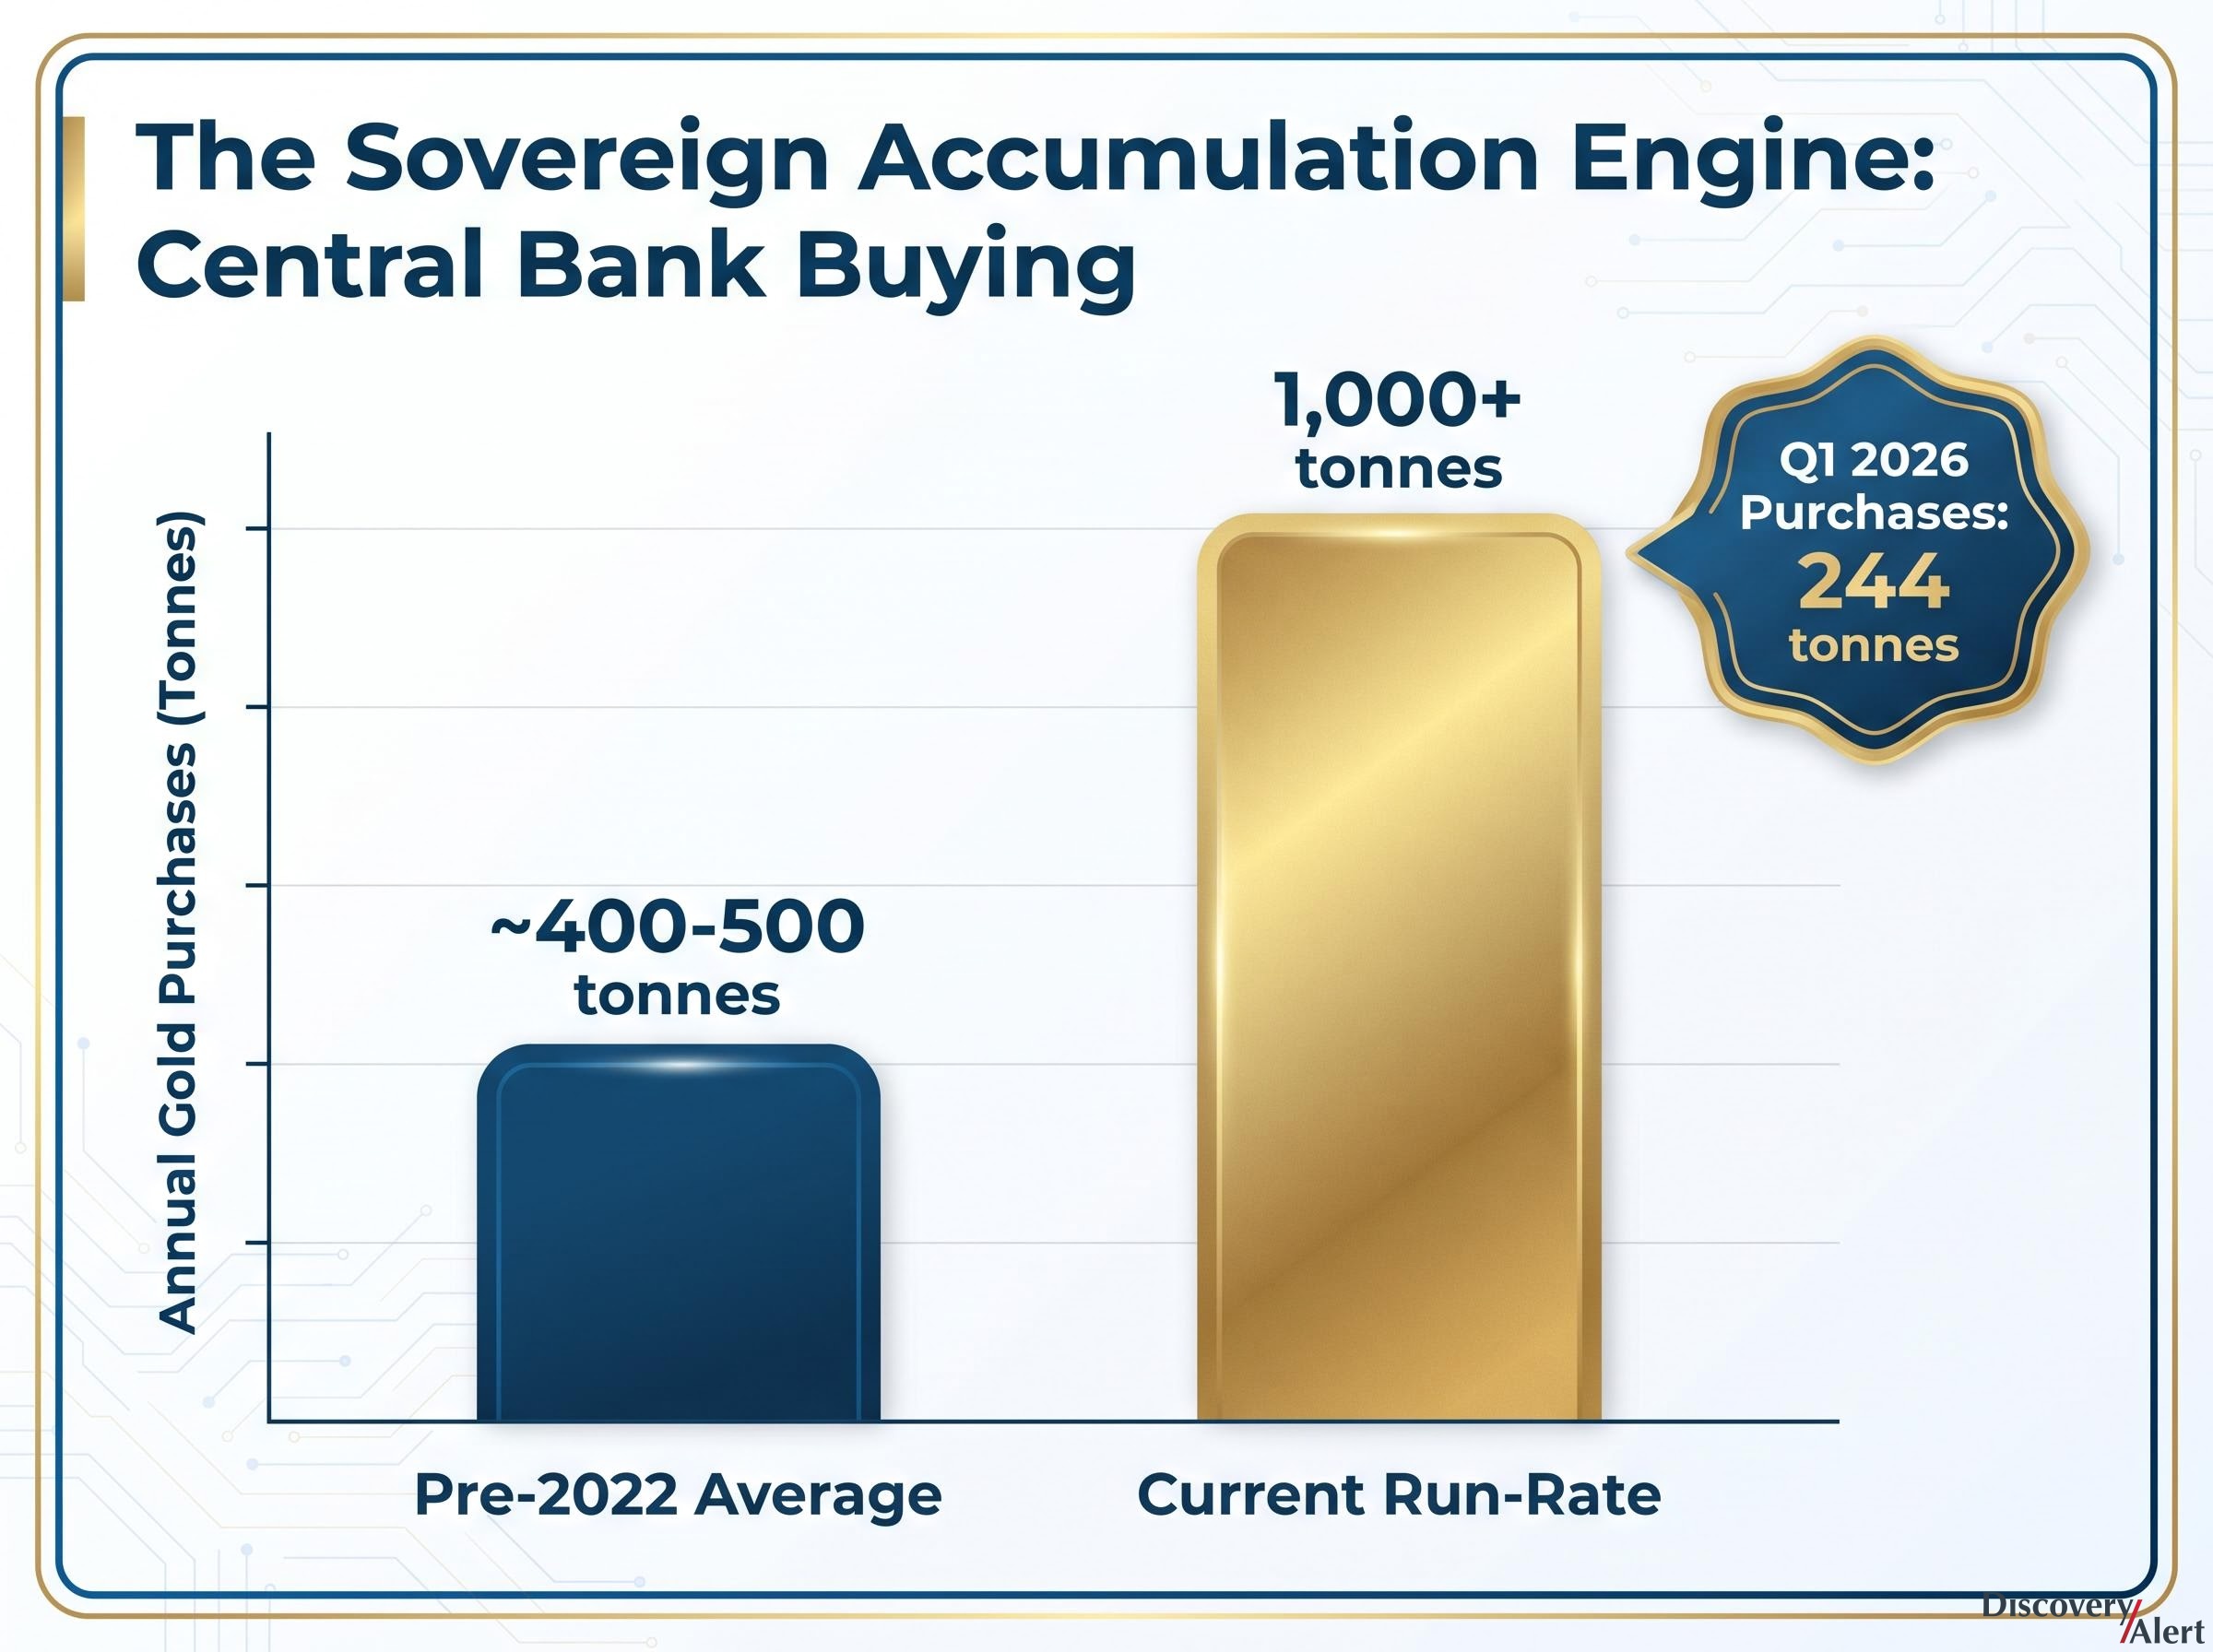
| Metric | Pre-2022 Average | Current Run-Rate | Notable Buyers |
|---|---|---|---|
| Annual central-bank buying | ~400-500 tonnes | 1,000+ tonnes | China, Singapore, Saudi Arabia, UAE |
| Q1 2026 purchases | N/A | 244 tonnes | Broad emerging-market participation |
| Stated rationale | Portfolio diversification | De-dollarisation, geopolitical hedging | South Korea (first purchase in 13 years) |
South Korea announced its first central-bank gold purchase in 13 years, citing persistent geopolitical risks, gold’s role as an inflation hedge, and its potential as a dollar alternative. Japan illustrates a deeper structural constraint: holding more than $1.1 trillion in US Treasury securities, Tokyo cannot sell large volumes without pushing American yields higher and devaluing its remaining reserves. That trap incentivises gold accumulation by default.
The geography extends well beyond Asia. Singapore, Saudi Arabia, the UAE, and central banks across Africa and Latin America are all expanding physical gold reserves. The Financial Times has reported that Washington discourages foreign central banks from freely deploying dollar reserves in ways that destabilise US markets, effectively reducing the usability of those assets and accelerating the diversification logic.
Peer-reviewed research on central bank reserve de-dollarisation covering the 2015-2025 period identifies financial sanctions, inflation tax, and dollar depreciation as the principal policy-level mechanisms driving sovereign managers toward gold, lending academic support to what institutional commentary has characterised as a structural rather than cyclical shift.
For decades, the playbook was straightforward. Gold moved inversely to real yields and the US dollar, and in sync with risk-off sentiment. Rate hikes were bearish. Dollar strength was bearish. Risk-on equity rallies were bearish.
That framework has fractured. Gold has risen alongside stronger equities and higher bond yields, a pattern the old models did not predict and cannot fully explain. The correlations have weakened rather than vanished entirely; institutional strategists continue to flag Fed policy and geopolitical conflict resolution as factors influencing the path and timing of gold’s moves, even while projecting structurally higher average prices.
Private-sector gold allocation remains at approximately 0.5% of assets, indicating structural under-ownership that amplifies the impact of every marginal demand shift.
Investors relying on the old correlation playbook to time entries and exits risk systematic misreading of gold’s behaviour in the current regime. The partial decoupling does not eliminate macro influence. It changes the weighting.
Gold’s price has been set, for decades, through a system dominated by unallocated leverage and cash-settled derivatives. Understanding why that system matters, and why its influence may be diminishing, is central to interpreting why institutional forecasts keep revising upward.
The mechanism works in three stages:
The eastward shift in price discovery is not merely a geopolitical observation; physical vault flows, exchange settlement data, and the growing share of Chinese and Middle Eastern refiners in total gold throughput all point to a structural reorientation in where gold’s clearing price is set.
Deutsche Bank’s published baseline projects gold averaging $4,600 in Q4 2026, $5,100 in 2027, and $5,442 in 2028. The bank’s $6,000 figure represents scenario or bull-case work, not its published base projection.
The critique, advanced by the original source’s assessment from global-facing first-tier liquidity providers, is that Deutsche Bank and peers built their models on decades of data from a paper-pricing regime. Those models are calibrated to a world where synthetic supply routinely capped physical scarcity signals. As that world changes, every forecast revision lags rather than leads the actual price, which is itself evidence that the structural shift remains underpriced in conventional modelling.
All major banks, including Goldman Sachs, J.P. Morgan, and Deutsche Bank, are reported to hold long gold positions on their own books.
The forecast landscape is not a single number. It is a layered probability structure, and treating any individual target as “the prediction” misrepresents how institutions frame their work.
| Institution | Published Target Range | Scenario / Bull Case | Key Stated Drivers |
|---|---|---|---|
| J.P. Morgan | Elevated scenarios ~$6,300 | Various horizons | Central-bank buying, macro stress |
| UBS | Base case revised toward $5,200+ | Higher upside scenarios | Geopolitical risk, de-dollarisation, Fed path |
| Deutsche Bank | $4,600 avg Q4 2026; $5,100 avg 2027 | $6,000 in scenario work | Non-dollar and real asset diversification |
| Societe Generale | ~$6,000 scenarios | Characterised as potentially conservative | Surging demand, macro shifts |
| Bank of America | 2026 avg revised to ~$4,360 | Structural $6,000 thesis maintained | Fiscal deficits, reserves, under-ownership |
Several of these targets, particularly the $6,300 and $6,200 figures from J.P. Morgan and UBS, have been revised lower as of mid-2026. They remain relevant as scenario or upside targets rather than standing base-case projections.
The original source frames $6,000 as the minimum floor target, set at the start of the year and described as unchanged and still valid. This represents a more aggressive stance than what major banks publish as base cases.
Bank of America has explicitly acknowledged that hitting $6,000 levels may take longer than originally modelled, while maintaining the view that such levels are structurally achievable. Consensus surveys from the Financial Times and S&P Global still place median forecasts below $6,000, confirming it remains a bullish scenario rather than the baseline across the broader analyst community.
The $8,000 target sits at the tail-risk end of the spectrum, contingent on fiscal deterioration, sustained geopolitical stress, and accelerating physical price discovery. Silver projections from the original source reach approximately $140 per ounce by the close of Q4, described as a doubling from synthetically suppressed levels.
The structural thesis translates into three distinct planning horizons:
Confirmation signals to monitor are more reliable than headline reactions:
Projects that were marginal at $1,800-$2,000 gold are now cash-flow positive at $4,400-$5,000 spot prices. This margin expansion supports renewed capital expenditure, exploration spending, and balance-sheet repair across the gold mining sector. An uptick in sector M&A and financing activity has been noted across industry commentary as elevated price levels push undeveloped deposits into strategic asset territory.
Rising production costs are compressing the apparent windfall at the asset level; sustaining capital inflation, labour, and energy inputs have all increased materially, meaning the margin expansion visible at spot prices overstates the free-cash-flow improvement for operators with older cost structures.
Royalty and streaming companies gain embedded operating leverage from contracts set at much lower reference prices, capturing margin expansion without direct operational risk. The same de-dollarisation drivers also underpin bullish theses in copper, uranium, and energy infrastructure, though gold’s monetary character means its structural bid can persist even when cyclical commodity demand softens.
Three core structural drivers are confirmed across independent institutional research:
These drivers are not dependent on any single geopolitical event. They are policy-level shifts with multi-year momentum. The institutional forecast landscape, from Deutsche Bank’s $4,600 Q4 average through J.P. Morgan’s elevated $6,300 scenarios, reflects this structural reading from different angles and with different levels of conviction.
The genuine risks deserve equal weight. If rates, deficits, or geopolitics evolve more benignly than the structural thesis assumes, lower outcomes within the current trading range remain plausible. Bank of America has explicitly acknowledged that its $6,000 thesis may take longer to materialise than originally modelled.
For investors assessing the $7,000-$8,000 crisis-extension scenario, our full explainer on gold in market stress scenarios maps the three-phase behavioural pattern that gold has historically followed during acute financial dislocations, covering the initial liquidity-driven selloff, the recovery bid, and the sustained safe-haven repricing that follows.
The most durable application of this framework is not a price target. It is a confirmation-signal checklist. The structural thesis is worth holding as long as sovereign accumulation persists, fiscal trajectories deteriorate, and private-sector allocation remains suppressed. When those signals shift, conviction should shift with them.
This article is for informational purposes only and should not be considered financial advice. Investors should conduct their own research and consult with financial professionals before making investment decisions. Past performance does not guarantee future results. Financial projections are subject to market conditions and various risk factors.
Deutsche Bank projects gold averaging $4,600 in Q4 2026, $5,100 in 2027, and $5,442 in 2028, with a $6,000 bull-case scenario. J.P. Morgan has modelled elevated scenarios around $6,300, while Bank of America maintains a structural $6,000 thesis despite acknowledging it may take longer to materialise.
Central banks are buying gold at over 1,000 tonnes per year, more than double the long-run average, primarily to reduce exposure to dollar-denominated debt, hedge against geopolitical risk, and diversify reserves away from US Treasuries. South Korea made its first central-bank gold purchase in 13 years in 2026, citing persistent geopolitical risks and gold's role as a dollar alternative.
The $8,000 gold price target is a crisis-extension scenario contingent on sustained fiscal deterioration, prolonged geopolitical stress, and an accelerating shift in price discovery from paper-based (cash-settled derivatives) to physical settlement. It is not a base-case projection from any major institution but represents the tail-risk end of the institutional forecast spectrum.
Gold's traditional inverse relationship with real yields and the US dollar has weakened because sovereign central-bank demand, running above 1,000 tonnes per year, provides a structural bid that overpowers the yield drag. De-dollarisation flows continue regardless of short-term dollar direction, and gold and equities are rising together as both respond to the same fiscal deterioration and liquidity dynamics.
Projects that were marginal at $1,800-$2,000 gold are now cash-flow positive at $4,400-$5,000 spot prices, driving renewed capital expenditure, exploration spending, and an uptick in sector M&A activity. However, rising sustaining capital costs, labour, and energy inputs have increased materially, meaning the free-cash-flow improvement for operators with older cost structures is smaller than the spot price move alone would suggest.


