
Saudi Aramco’s Exports Hold, but War-Risk Costs Tell a Darker Story
Aug 17, 2026


Gold has added roughly 500 points since its late-June trough, pressing into the low-4,500s, and the rally has unfolded with the kind of precision that makes cycle analysts look prescient. Jim Curry, Chief Analyst at Gold Wave Trader, published the bottoming window months in advance. The composite trough arrived on schedule. The confirmation signal printed days later. The subsequent rally delivered nearly the exact magnitude his framework projected.
Now Curry is watching for the opposite signal. The 34-day cycle that powered this advance has entered its topping zone, and the reversal that would trigger a sharp, potentially fast correction has not yet materialised but is expected imminently. For gold investors, the question is not whether a pullback is coming, but how deep it reaches and whether it changes the larger trend.
What follows is a breakdown of the cycle signals driving gold’s near-term reversal risk, the realistic correction range in price terms, and why the medium-term roadmap through the 72-day and 154-day cycles still points to significantly higher prices into early 2027. The aim is to frame any near-term dip as a decision point, not a panic signal.
The rally began from a specific, verifiable price event. On 30 June 2026, gold futures printed composite cycle lows across both active contracts, bottoming at 4,015.30 on the December 2026 contract and 3,955.40 on the August 2026 contract. Curry had identified mid-June to mid-July as the ideal bottoming window for all three of his tracked cycles. The market obliged.
Six days later, the confirmation signal arrived.
Reuters gold futures pricing from mid-August 2026 placed the December contract at $4,452.70 per ounce, with spot gold at $4,395.04 after slipping from a two-month high, independently corroborating the low-4,500s range that Curry’s framework identified as the 34-day topping zone.
On 6 July, gold printed an upside reversal above 4,211.90 on the August 2026 contract, confirming the bullish phase of the 34-day cycle was active.
From that threshold, gold gained nearly 300 additional points. The key milestones unfolded in sequence:

The scale of that move is both the rally’s achievement and its liability. A 500-point advance from a 34-day cycle trough pushes the wave well into maturity. The same reversal logic that confirmed the upside on 6 July will, when it prints on the downside, mark the beginning of the correction phase.
Curry’s framework tracks three recurring rhythms in gold’s price behaviour, each operating on a different timeframe:
These cycles nest inside one another. The 34-day wave oscillates around the 72-day trend, which itself moves within the 154-day structure. When all three align at a trough, as they did in late June, the resulting rally carries structural weight. When only the shortest cycle is topping while the larger two remain in upward phases, the correction tends to be countertrend rather than trend-defining.
Historical gold bull market cycles provide the baseline context for interpreting why a 34-day countertrend correction within a still-intact 72-day and 154-day uptrend carries a structurally different implication than a correction that follows a composite cycle peak across all three timeframes.
The reversal mechanism is central to the methodology. A move above or below a defined price threshold on a given contract confirms that a cycle’s directional phase has changed. Curry does not rely on time alone; the price signal must print.
The prior 34-day cycle topped on 16 May 2026, confirmed by a downside reversal below 4,510.10 on the June 2026 contract. That signal triggered roughly 500 points of weakness before the late-June low.
That May episode illustrates the mechanism investors should be watching for now. The 34-day cycle has been running long enough for a downside reversal to be due. Once it prints, the correction phase begins, and the prior episode suggests the move can be both sharp and substantial.
As of 16 August 2026, the downside reversal signal for the 34-day cycle had not yet materialised. The topping zone is active, but the price confirmation that would define the near-term peak has not printed.
When it does, Curry’s framework identifies two primary downside reference levels: the 34-day moving average and the lower boundary of the 72-day cycle channel. These are the zones where prior 34-day corrections have found support within still-bullish medium-term structures.
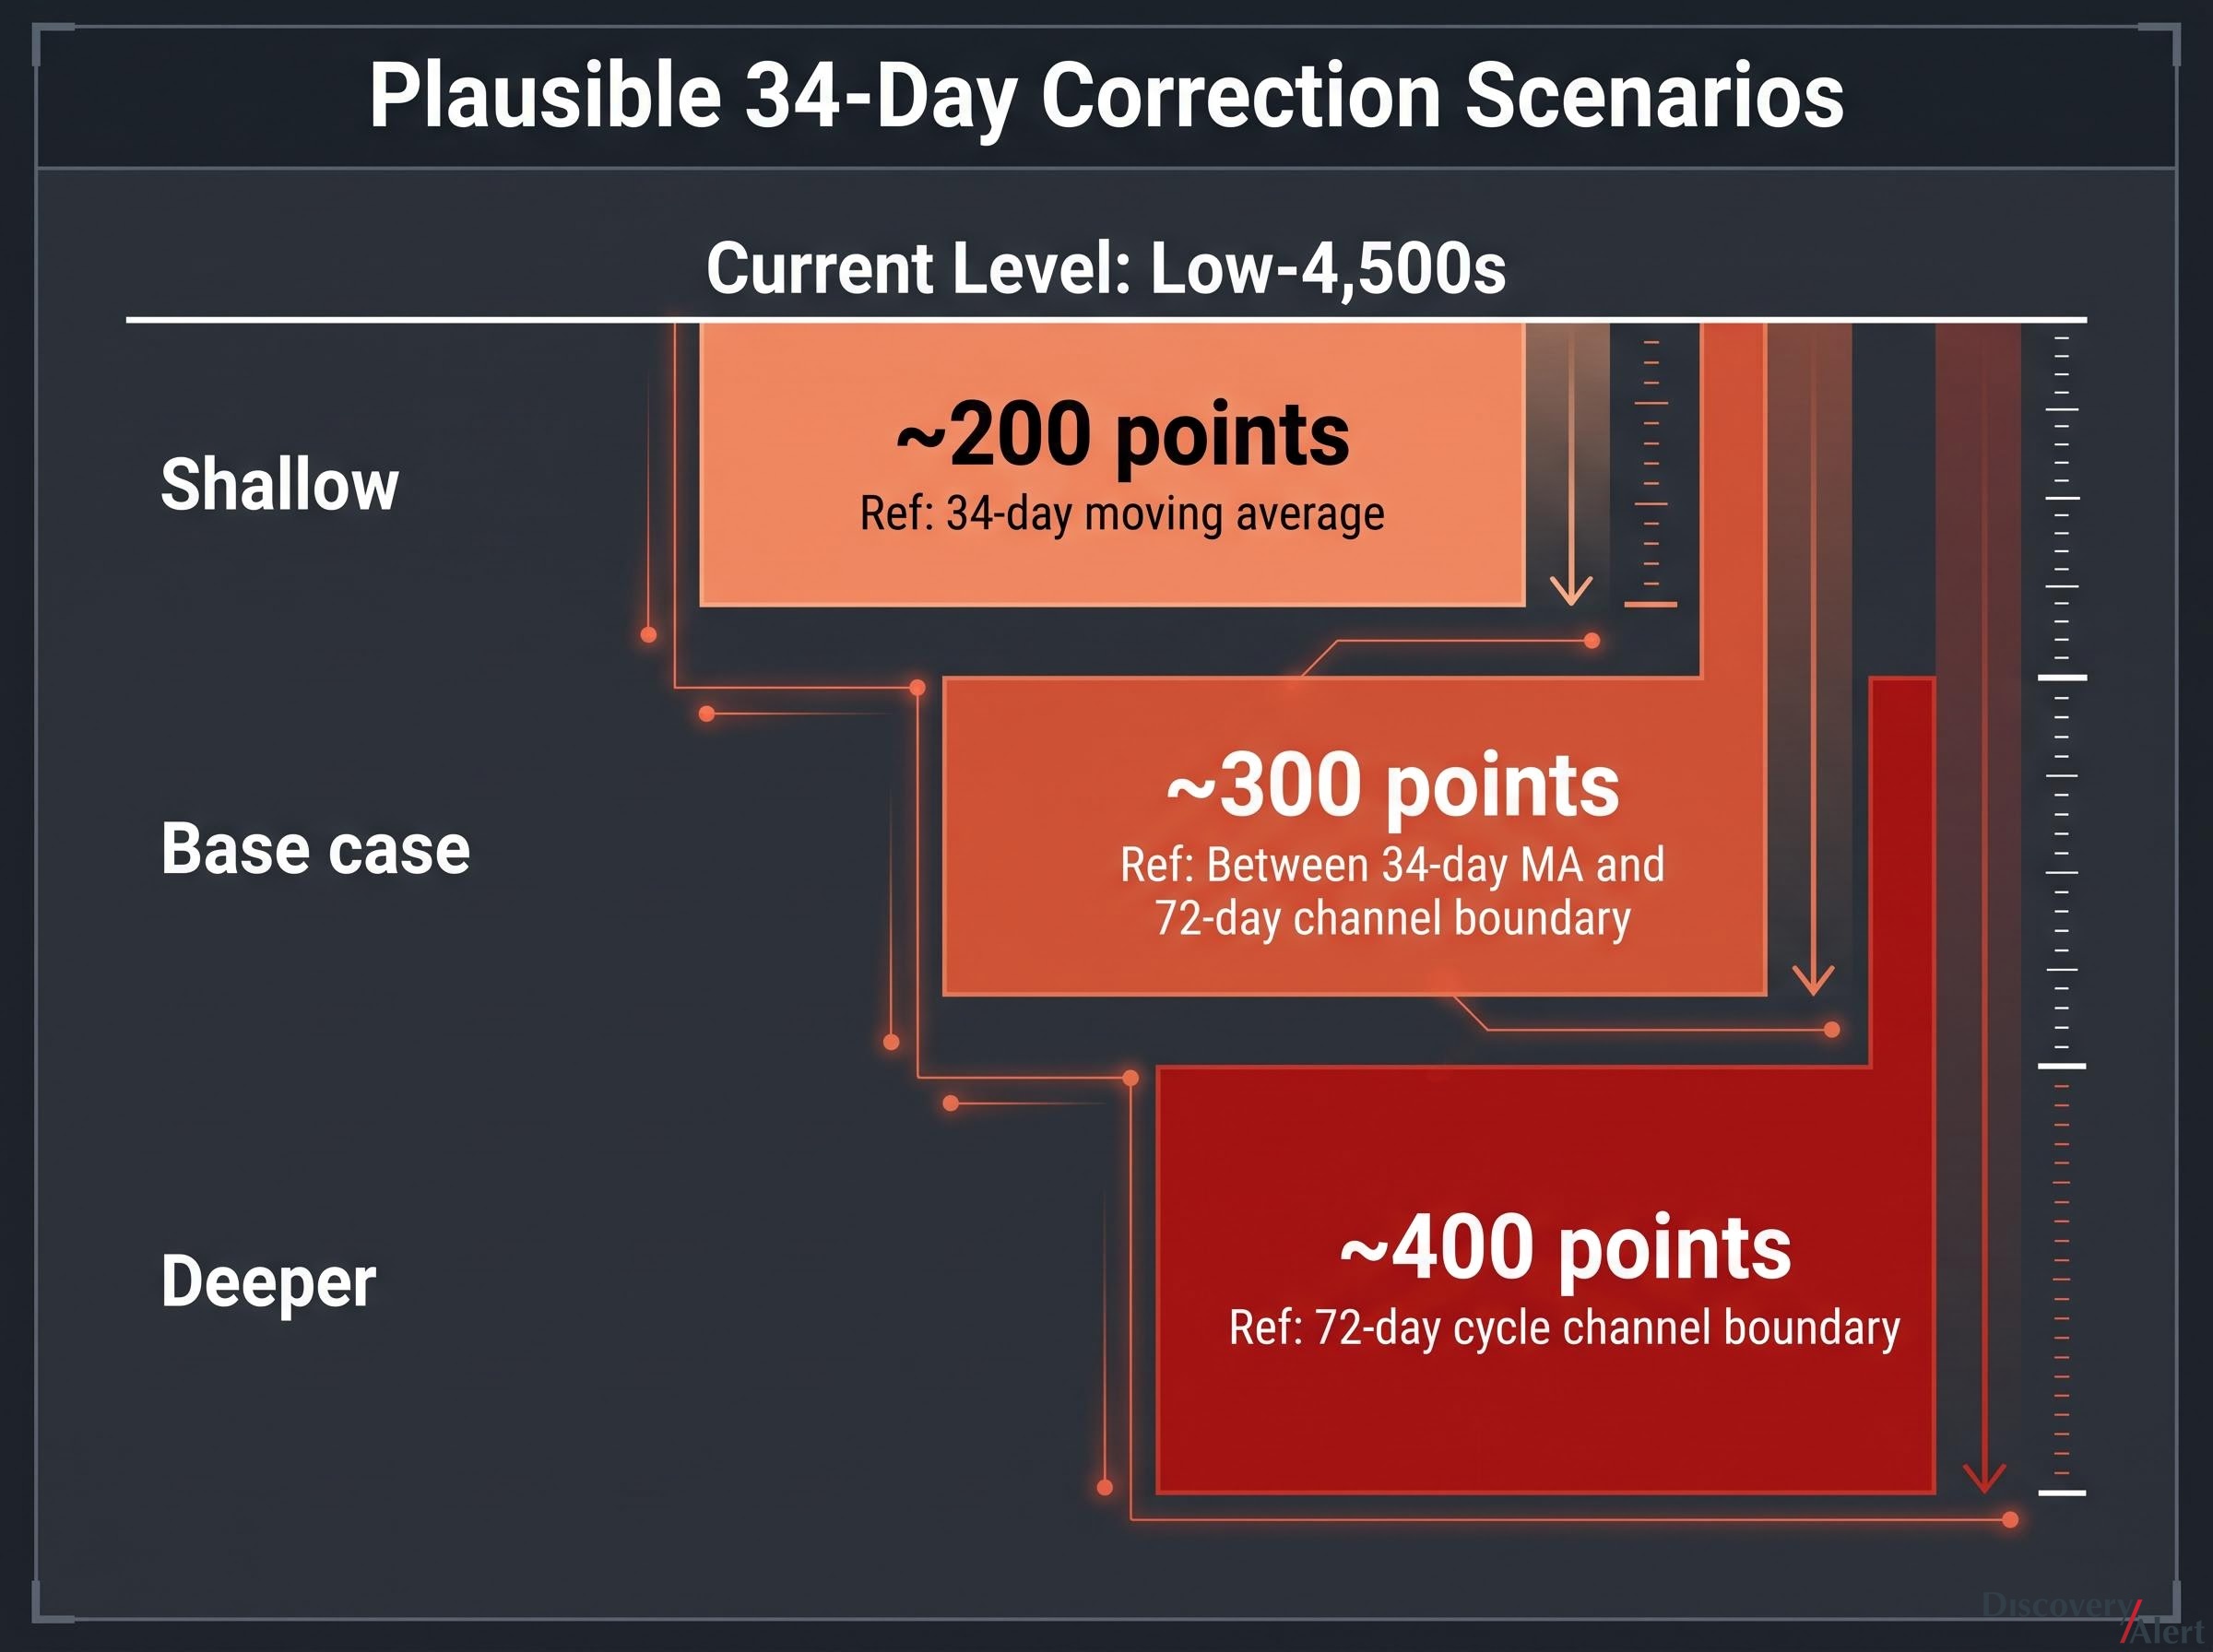
Based on conservative application of the framework’s correction logic, the plausible drawdown range from the current low-4,500s level spans three scenarios:
| Correction Scenario | Approximate Price Drawdown | Key Reference Level |
|---|---|---|
| Shallow | ~200 points | 34-day moving average |
| Base case | ~300 points | Between 34-day MA and 72-day channel boundary |
| Deeper | ~400 points | 72-day cycle channel boundary |
These estimates represent framework-derived projections, not specific targets Curry has published. The 200-400-point band is consistent with how prior 34-day corrections have behaved within the current cycle structure.
The prior precedent is instructive. The May reversal produced approximately 500 points of weakness into the 30 June low. A correction of that magnitude from the current range would bring gold back toward the 4,000-4,100 zone, though the base case expectation is for a somewhat shallower move given that the larger cycles are now in upward phases rather than declining into a composite trough.
The anticipated correction is expected to be countertrend in nature. The 72-day and 154-day cycles remain in upward phases, and the current data does not suggest a primary trend reversal.
For investors holding gold positions, knowing the plausible correction range in advance transforms an intimidating drawdown into a manageable, anticipated event.
The 30 June composite low did more than launch a 34-day rally. It aligned with Curry’s published bottoming window for all three cycles simultaneously, giving the subsequent advance structural legitimacy that extends well beyond the near-term wave.
Curry’s own published statistics frame the medium-term upside. In his 7 June 2026 analysis, he projected a 14-20% rally from the 72-day low, with duration into “late-summer to early-autumn.” His 12 July 2026 update reiterated the expectation, noting the rally should extend into “September, plus or minus.” The same June analysis documented that average rallies off 154-day cycle lows have historically run 20-25%.
| Cycle | Projected Trough Window | Expected Rally Magnitude | Projected Peak Window |
|---|---|---|---|
| 72-day | Mid-June to mid-July 2026 (Curry-published) | 14-20% (Curry-published) | September, plus or minus (Curry-published) |
| 154-day | Mid-June to mid-July 2026 (Curry-published) | 20-25% historical average (Curry-published) | ~February 2027 (extrapolated) |
The projected timeline, blending Curry’s published expectations with framework-derived extrapolations, unfolds in five stages:
The distinction between directly sourced and extrapolated projections matters. Curry’s published work supports the medium-term bullish bias through his own statistics. The specific 5,100-5,200 target and February 2027 timeline represent a conservative reading of those statistics applied forward, not claims he has made.
The J.P. Morgan gold price outlook for 2026-2027, published in June 2026, projected prices reaching $6,000 per ounce by year-end and potentially $6,300 by end-2027, driven by central bank demand, geopolitical risk, and Federal Reserve policy, providing institutional context for the medium-term bullish bias that Curry’s cycle framework also projects.
The anticipated 34-day correction creates a tactical dip-buying opportunity, but only if the entry conditions are met and the larger cycle structure remains intact. The framework provides three observable conditions that would confirm a valid entry:
The framing of a gold pullback opportunity within a confirmed uptrend is central to how cycle-based investors distinguish between corrections that should be bought and corrections that signal regime change, a distinction the current 34-day structure makes unusually tractable given the alignment of the larger cycles.
All three conditions need to be present for the dip-buying thesis to hold within the cycle framework. A correction that breaks below the 72-day channel boundary while the larger cycles show deterioration would signal a different, more cautious positioning.
Cycle roadmaps identify high-probability windows, not guaranteed outcomes. The framework is probabilistic and remains sensitive to macro shocks that fall outside its scope.
The primary invalidation condition sits well below current levels. Curry has identified the November 2022 low as the secular floor for the dominant four-year cycle uptrend. A break of that level would signal that the multi-year bull structure has ended. Current price action is nowhere near that threshold, but it defines the ultimate risk boundary for the framework.
This article is for informational purposes only and should not be considered financial advice. Investors should conduct their own research and consult with financial professionals before making investment decisions. Past performance does not guarantee future results. The cycle projections discussed are probabilistic and subject to change based on market developments.
Gold’s cycle structure in mid-August 2026 presents a layered signal. The 34-day wave is topping, and a sharp corrective move is likely within days to weeks. The 72-day and 154-day cycles remain in upward phases, keeping the medium-term bias pointed toward higher prices into late 2026 and early 2027, with an extrapolated target range of approximately 5,100-5,200 if Curry’s historical rally statistics hold.
Longer-term gold price projections that extend beyond the 154-day cycle horizon draw on both technical and macro frameworks, with some models identifying price targets substantially above the conservative 5,100-5,200 range derived from Curry’s historical rally statistics applied to the 30 June base.
The key variable is whether the anticipated correction stays within the countertrend bounds defined by the larger cycles. A pullback to the 34-day moving average or 72-day channel boundary that finds support would reinforce the medium-term bullish thesis. A correction that deepens beyond those reference levels would warrant reassessment.
Corrections associated with the larger four-year cycle are expected to be countertrend and to hold above the November 2022 low, the level Curry has identified as the boundary that would signal the dominant uptrend has ended.
The signal to watch is specific: a confirmed downside reversal in the 34-day cycle that defines the near-term top and begins the correction phase. When it prints, investors will know the pullback is underway. What happens at the support levels will determine whether the next up-leg is a buying opportunity or something more cautious.
The 34-day cycle is the shortest of the three recurring price rhythms tracked by cycle analyst Jim Curry, generating near-term tradeable swings between troughs and peaks roughly every five weeks. It nests inside the longer 72-day and 154-day cycles, so when only the 34-day cycle is topping, any resulting correction is typically countertrend rather than a signal that the broader trend has reversed.
Based on Jim Curry's cycle framework, the plausible drawdown range spans three scenarios: a shallow correction of around 200 points to the 34-day moving average, a base-case correction of around 300 points, or a deeper move of around 400 points to the 72-day cycle channel boundary. The prior 34-day cycle correction in May 2026 produced approximately 500 points of weakness, though the current correction is expected to be shallower because the larger cycles remain in upward phases.
Curry has published expectations for a 14-20% rally from the 72-day cycle low and noted that average rallies off 154-day cycle lows have historically run 20-25%. Applying his published statistics conservatively to the 30 June 2026 base produces an extrapolated target range of approximately 5,100-5,200, with the rally potentially extending into early 2027, though this specific target is an extrapolation rather than a figure Curry has directly published.
Curry's framework requires a confirmed downside reversal below a defined price threshold on the relevant futures contract, not just the passage of time. As of 16 August 2026, that signal had not yet printed, meaning the topping zone was active but the cycle peak had not been formally confirmed.
Curry has identified the November 2022 low as the secular floor for the dominant four-year cycle uptrend; a break of that level would signal the multi-year bull structure has ended. More immediately, a correction that breaks below the 72-day cycle channel boundary while the larger cycles show deterioration would also warrant a more cautious reassessment of the medium-term bullish thesis.


