
Aramco Targets Europe With Deeper-Than-Expected Crude Price Cut
Aug 17, 2026


Precious metals staged a broad rally on 14 August 2026, with gold and silver leading gains while crude oil benchmarks retreated sharply, creating a split-screen commodity session that carries direct implications for mining investors. The session crystallised a divergence that has been building across 2026: precious metals prices have traded at historically elevated levels while energy markets contend with demand-side headwinds. Price action on this single day illustrated the structural tension between metals and energy in real time. This article lays out the 14 August commodity price snapshot using the best available data, explains what drove each market’s move, examines why silver and oil moved in opposite directions, and translates the combined dynamics into what they mean for mining sector margins and investor positioning.
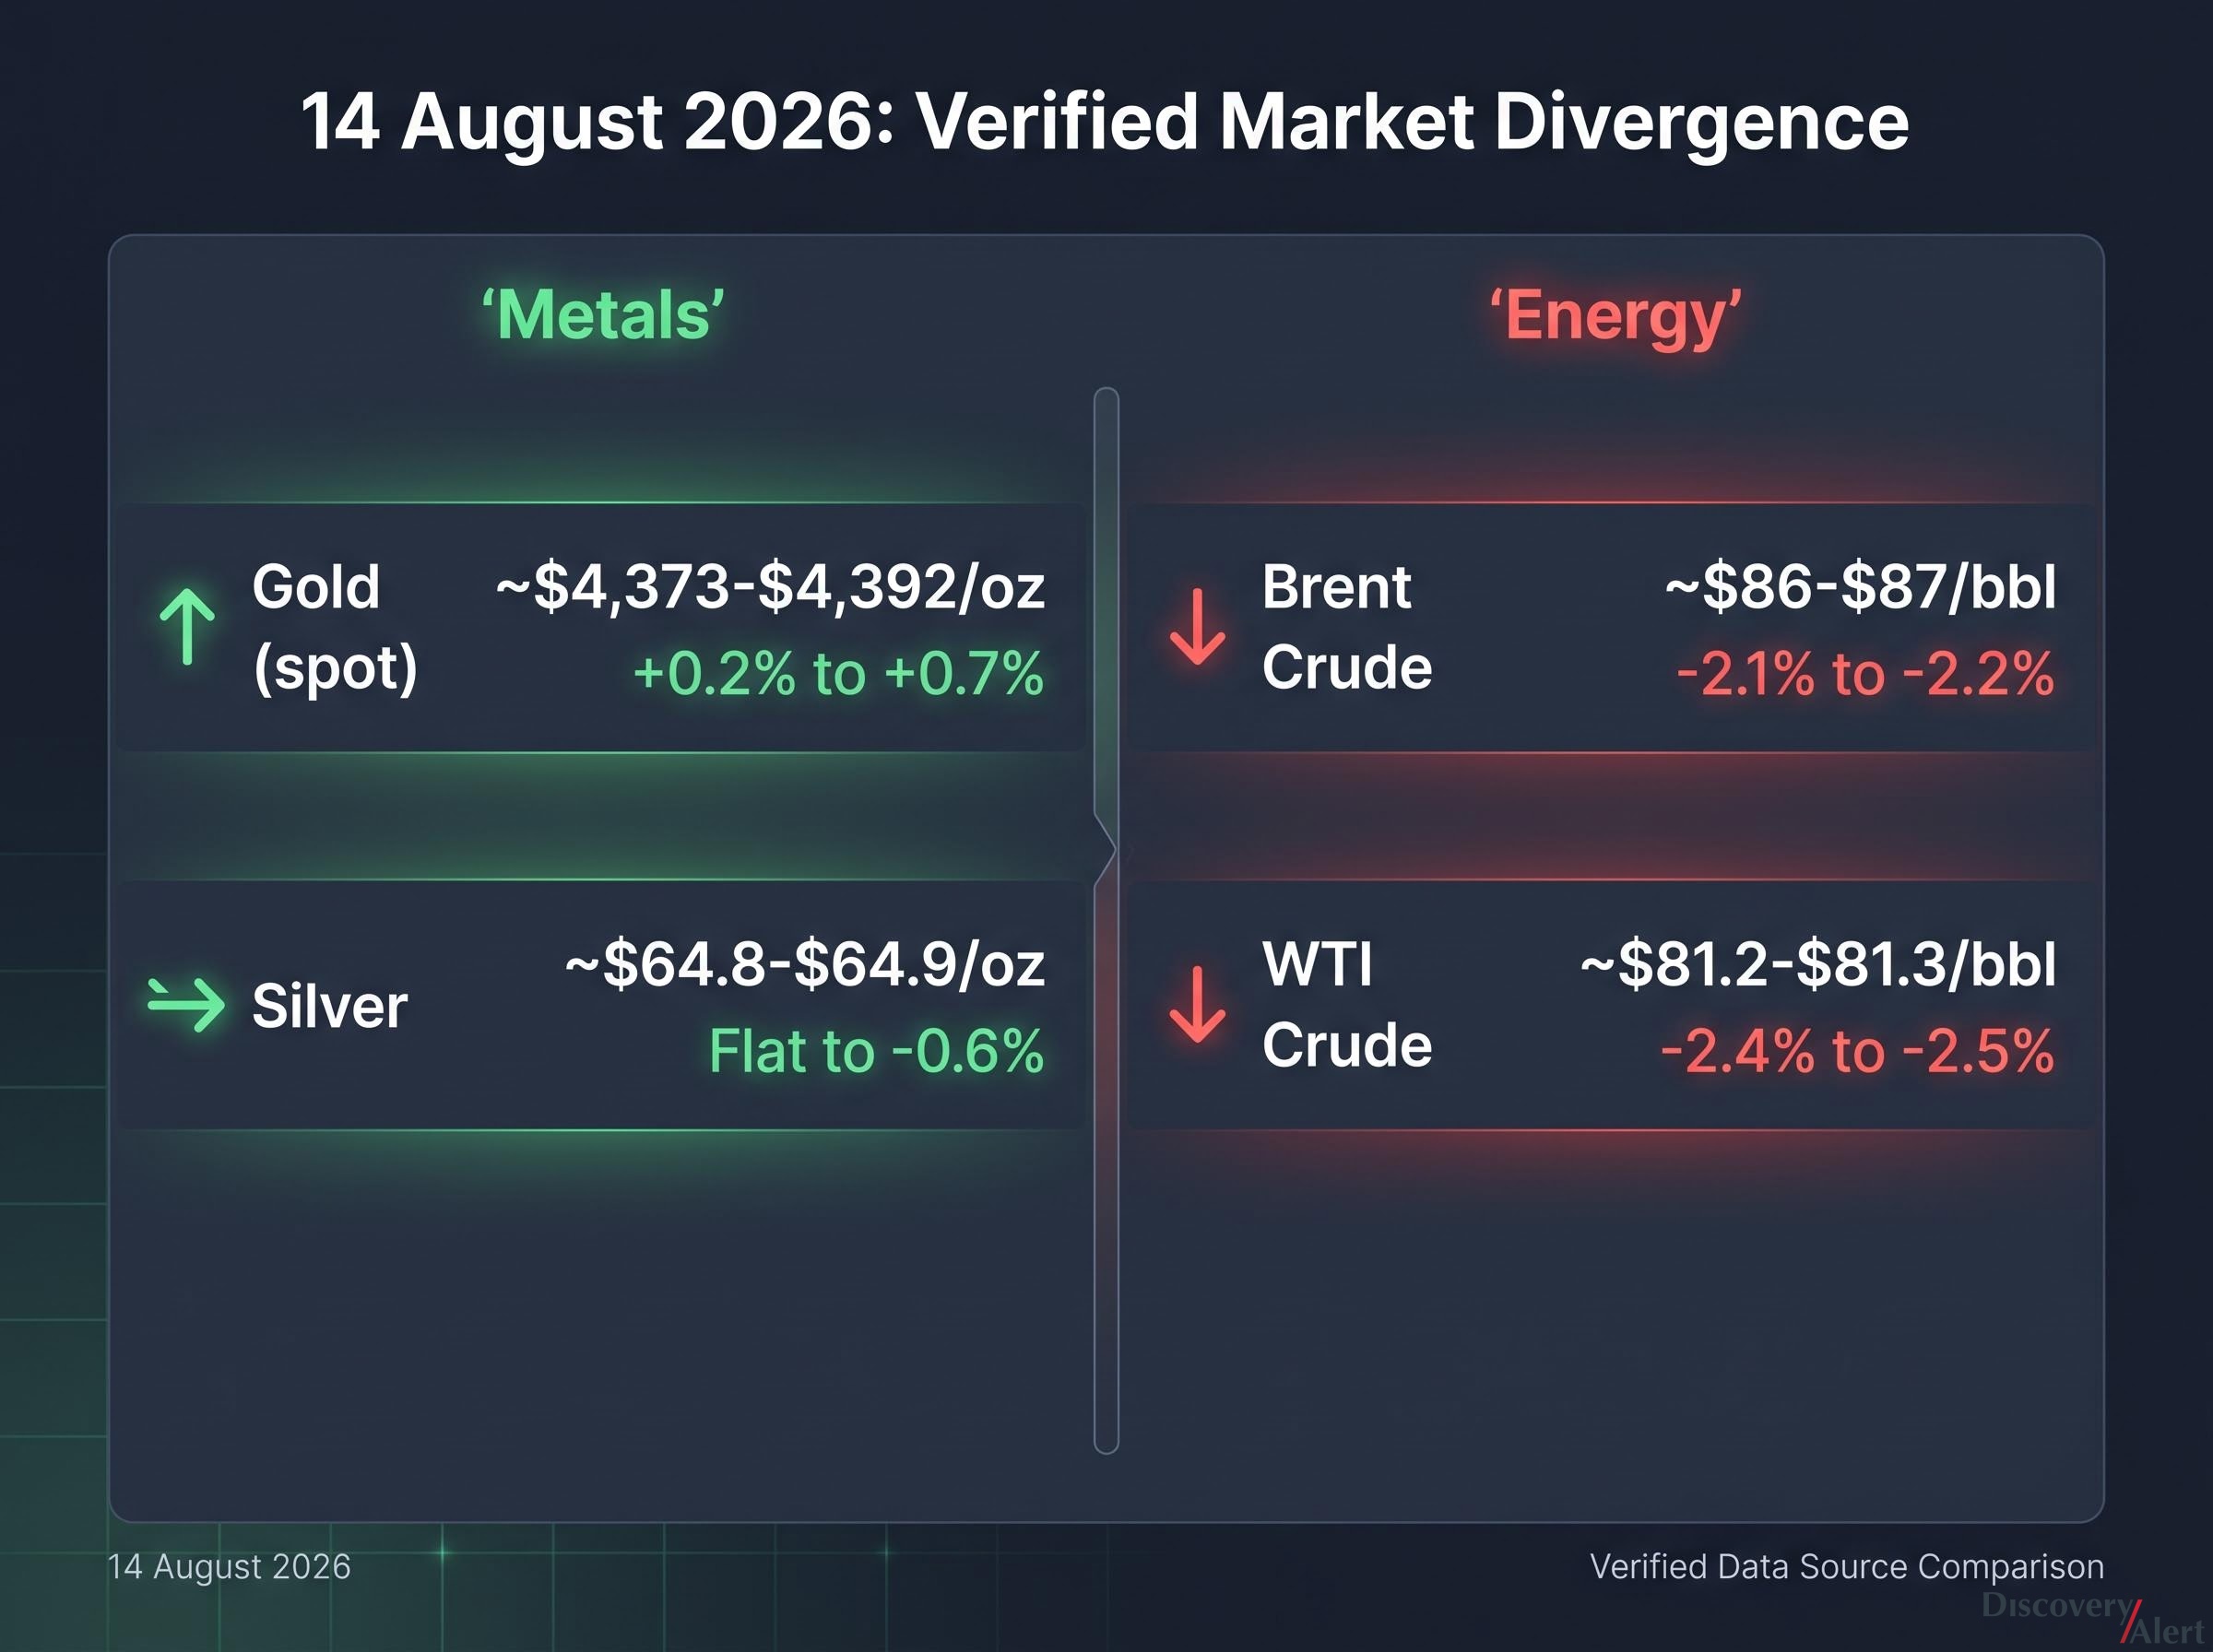
The session split cleanly down the middle. Gold and silver advanced while crude oil fell across both major benchmarks, producing a single-day divergence that captured two entirely different market narratives playing out simultaneously.
Independently verified data from Trading Economics, BullionVault, Forbes, USA Today, and CNBC places the day’s confirmed price action as follows:
The LBMA Gold Price and LBMA Silver Price methodologies, administered by ICE Benchmark Administration, define the globally recognised benchmark prices for unallocated gold and silver delivered in London, and serve as the reference point most institutional participants use when verifying spot price levels against intraday trading data.
| Asset | Verified Price | Verified Daily Move | MDC Markets Price | MDC Markets Daily Move |
|---|---|---|---|---|
| Silver | ~$64.8-$64.9/oz | Flat to -0.6% | $75.495/oz | +7.47% |
| Gold (spot) | ~$4,373-$4,392/oz | +0.2% to +0.7% | $4,713.30/oz | +3.84% |
| Brent Crude | ~$86-$87/bbl | -2.1% to -2.2% | $104.40/bbl | -4.21% |
| WTI Crude | ~$81.2-$81.3/bbl | -2.4% to -2.5% | $101.85/bbl | -3.06% |
Sourcing note: A separate dataset from MDC Markets via Mining.com reported substantially higher levels for silver and gold, and substantially higher absolute levels for crude oil, on the same date. Multiple independent sources place silver and gold materially below the MDC Markets figures. Readers should treat the MDC dataset as potentially illustrative rather than a confirmed record of the session.
Platinum ($1,973.85, +4.22%) and palladium ($1,496.50, +5.39%) also advanced sharply according to the original source, while copper gained +2.72% to $5.6358 per pound.
Two separate stories drove the session. They operated independently, but the result was a rare single-day illustration of the structural decoupling between energy and precious metals.
Gold price thresholds in the $4,300-$4,400 range have generated repeated algorithmic and sentiment-driven reactions throughout August 2026, with technical analysts divided on whether sustained trading near these levels represents a genuine structural re-rating or a momentum-driven overshoot.
The forces were distinct. Oil responded to a demand-side data point; metals responded to structural positioning and safe-haven dynamics. The divergence was not coincidental. It was two different markets processing two different signals.
Silver occupies a position unlike any other major commodity. It functions as both a monetary asset and an industrial input, and this dual identity is the structural mechanic that made the 14 August price action possible.
Silver’s monetary characteristics:
Silver’s industrial characteristics:
This dual role makes silver characteristically more volatile than gold. It can be driven by risk aversion and by factory output simultaneously, a combination no other major commodity replicates at the same scale.
Silver versus gold allocation decisions become more complex when both metals are advancing simultaneously, because the two assets carry different volatility profiles, different industrial demand sensitivities, and different liquidity characteristics that affect how each responds to the same macro trigger.
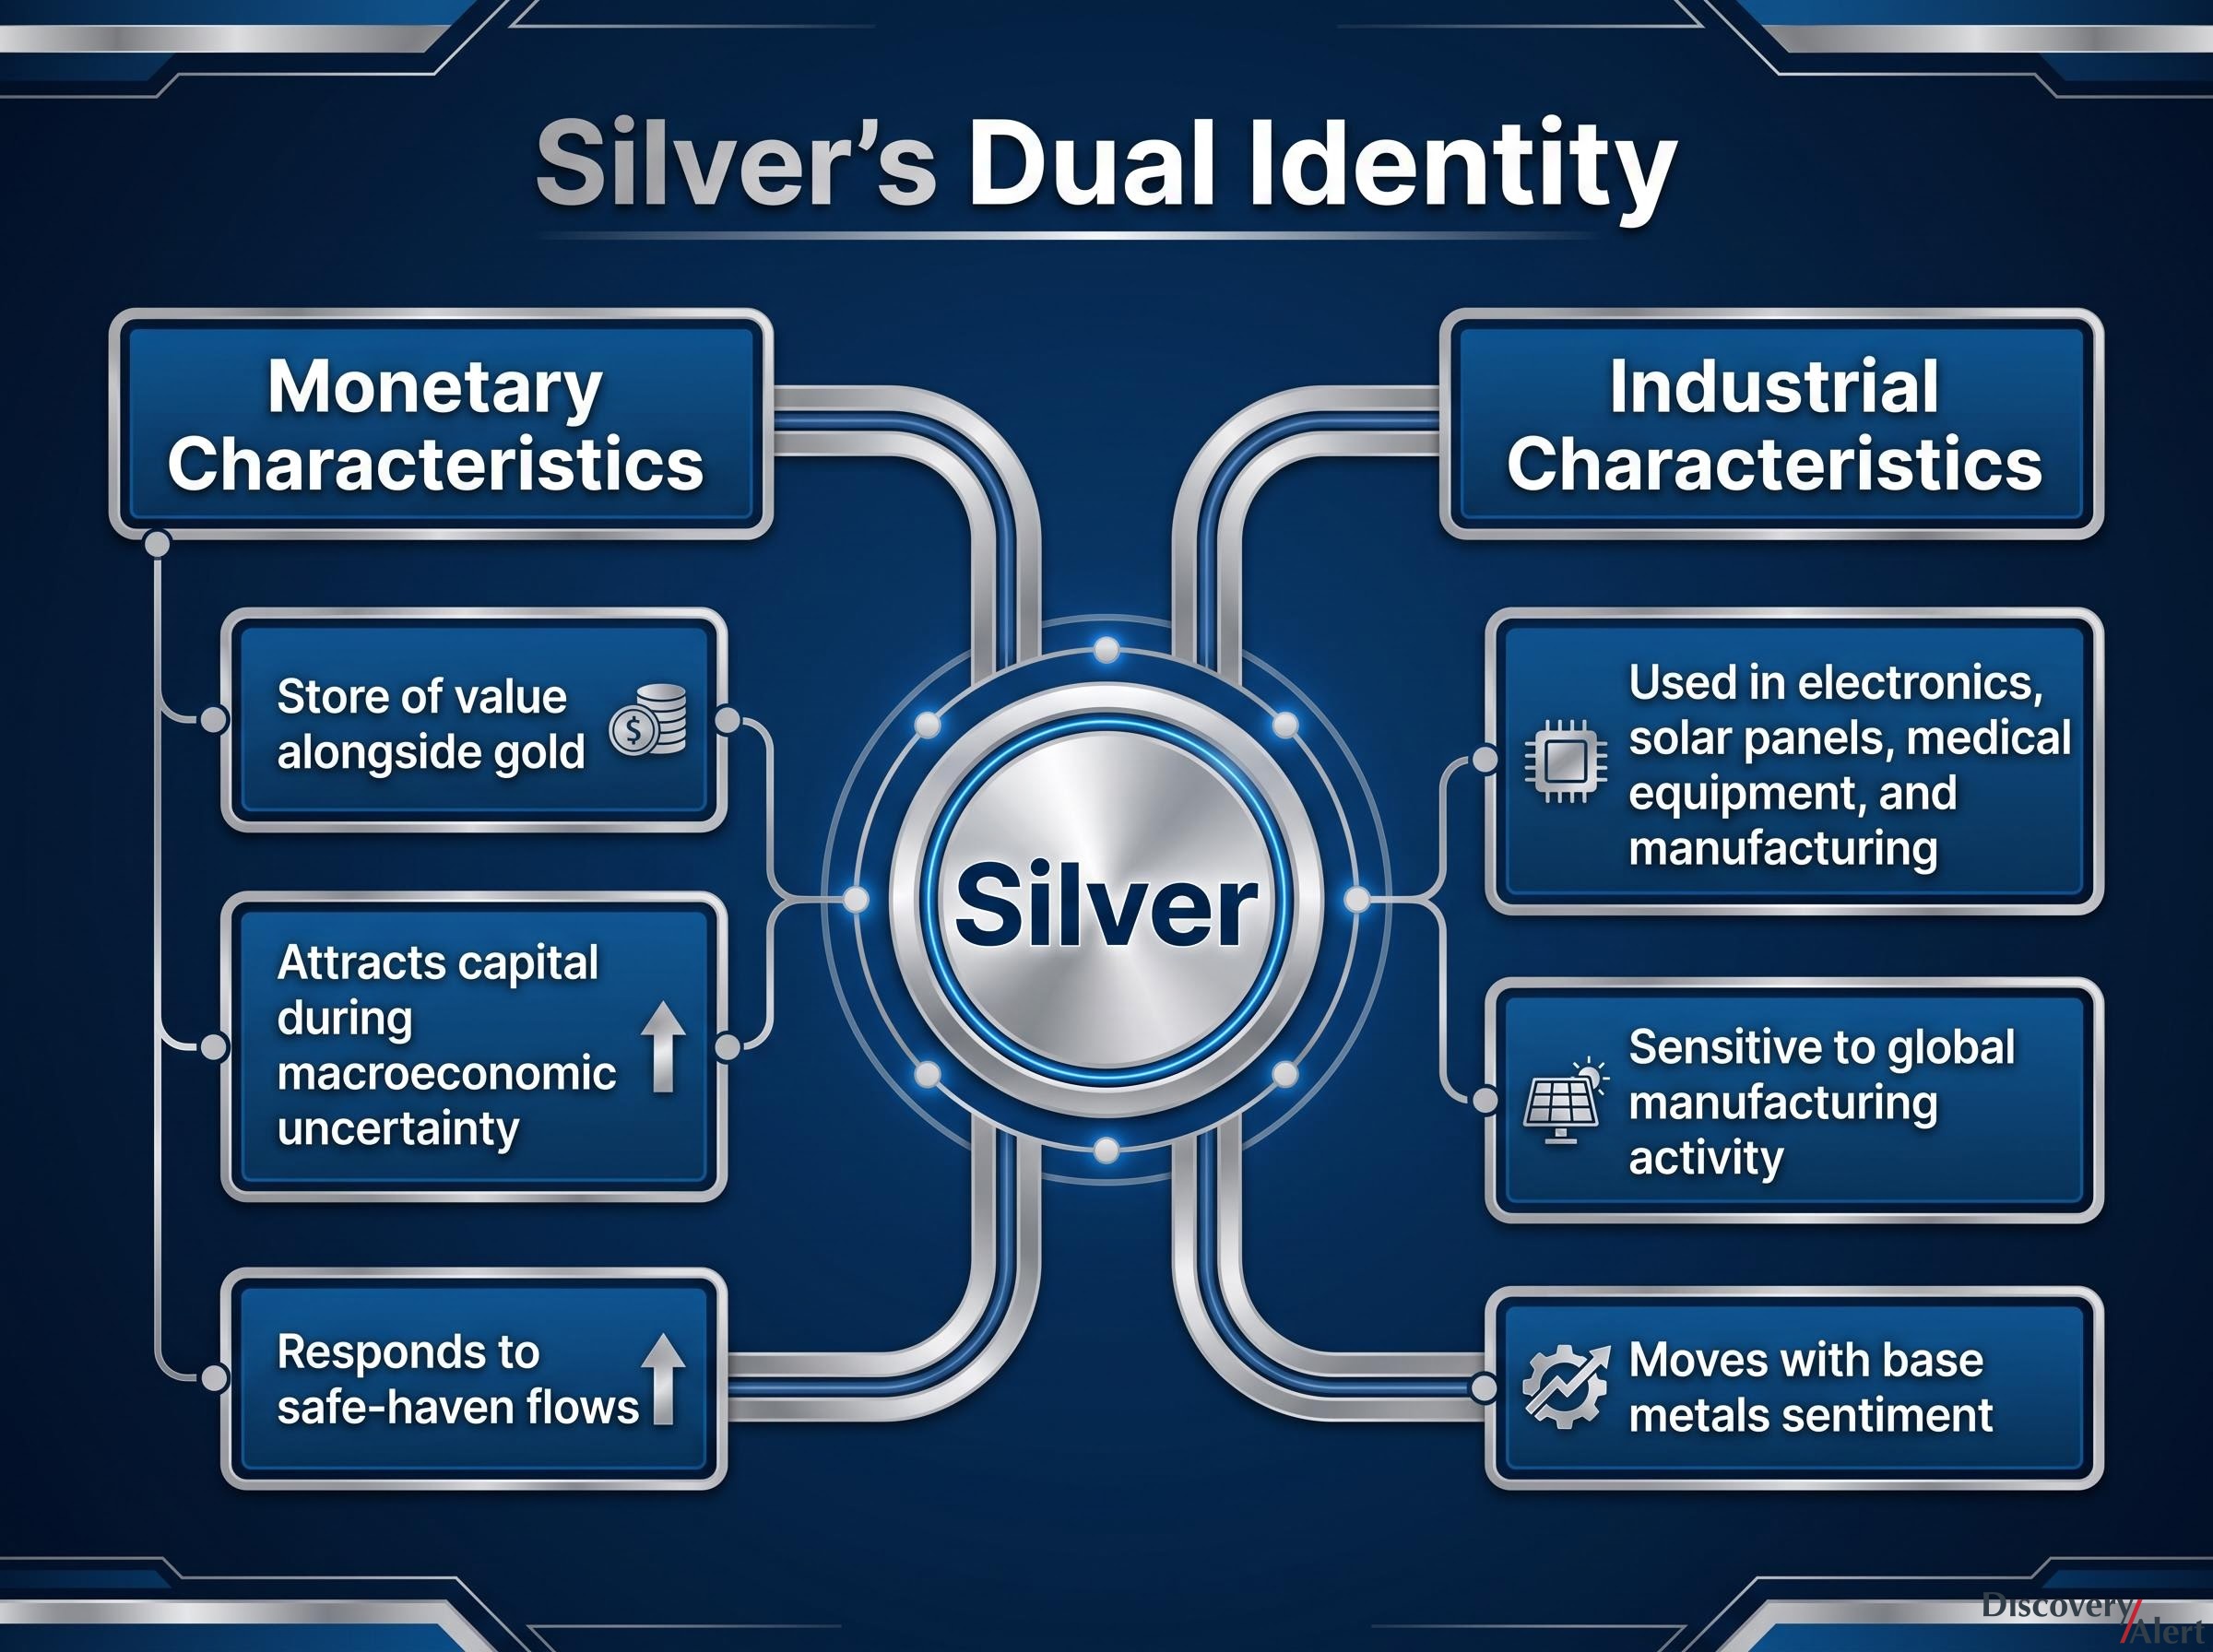
Key insight: Silver’s dual identity means it can respond to fear and to factories at the same time. This structural characteristic explains why silver often moves more dramatically than gold during commodity sector rotations.
Gold and silver have traded at historically elevated levels throughout 2026 relative to prior decades. This sustained re-rating has periodically drawn investor attention to platinum and palladium for relative-value comparison, with both PGMs advancing +4.22% and +5.39% respectively on 14 August according to the original source data.
The 14 August session did not just produce interesting price charts. It produced a specific profitability signal for mining operators.
Energy is a major input cost for most mining operations, powering haul trucks, processing plants, and site infrastructure. When oil prices fall, that cost input declines. When metals prices rise simultaneously, revenues increase. The combination compresses margins in the right direction without requiring any change in production volumes.
Gold production costs have been rising steadily across the sector even as headline revenues reached record levels, which means the energy input tailwind visible on 14 August is partially offsetting cost pressures that have been compressing net margins throughout the year.
The mechanism works in three steps:
Gold, silver, platinum, palladium, and copper all advanced on the session. Brent and WTI both fell. The double tailwind was live across the full commodity dashboard.
Copper’s +2.72% gain (per the MDC Markets dataset) added breadth to the metals advance, though aluminium’s -1.21% decline on the same session indicated the rally was not universal across all industrial metals. This analytical framework holds regardless of which specific price dataset is used for the session, because both the verified and MDC Markets figures show metals advancing and oil retreating directionally.
The 14 August session did not occur in isolation. It unfolded against a 2026 backdrop where gold and silver have traded at historically elevated levels throughout the year, creating a fundamentally different environment for mining economics than the conditions that prevailed in prior commodity cycles.
Three conditions are converging in mid-2026:
Round-number gold price levels continue to function as genuine psychological and algorithmic triggers, generating measurable shifts in market behaviour each time a threshold is approached or breached. For mining-focused investors, this combination of high metals prices, significant price thresholds, and a structural energy cost tailwind represents a set of conditions worth monitoring closely rather than treating as routine.
For readers wanting to understand the macro framework behind 2026’s historically elevated metals prices, our dedicated guide to the precious metals supercycle thesis presents the structural case for sustained multi-year re-rating, covering currency debasement dynamics, central bank demand, and the historical parallels that inform the $7,000 gold scenario.
The 14 August session’s defining characteristic was simultaneous advance across precious and base metals alongside a confirmed energy retreat. That combination, visible in a single day’s data, provides a clean case study in commodity divergence.
The sourcing conflict between MDC Markets and independently verified data is acknowledged throughout this article. The analytical frameworks discussed, silver’s dual role, gold’s psychological thresholds, the oil-to-mining-margin dynamic, and the 2026 re-rating context, hold regardless of which price set proves accurate. The directional story is consistent across both datasets.
For mining and commodity investors, the oil-to-mining-margin double tailwind, where revenues rise and a key cost input falls simultaneously, is the session’s most durable and repeatable signal.
Sessions like 14 August are diagnostic moments. Price divergence between metals and energy is a signal worth tracking systematically, not a one-day anomaly to dismiss.
This article is for informational purposes only and should not be considered financial advice. Investors should conduct their own research and consult with financial professionals before making investment decisions.
Gold and silver have traded at historically elevated levels throughout 2026, with gold trading in the $4,373-$4,392 per ounce range and silver around $64.8-$64.9 per ounce based on independently verified data from mid-August 2026.
Gold and silver responded to safe-haven positioning and psychological price thresholds, while crude oil dropped on an unexpected U.S. inventory build that signalled weaker demand; the two markets were processing entirely different signals simultaneously.
When oil prices fall, mining operators benefit from lower energy input costs for haul trucks and processing plants, and when metals prices rise at the same time, revenues increase, expanding operating margins without any change to production volumes.
Silver functions as both a monetary safe-haven asset and an industrial input used in electronics, solar panels, and medical equipment, which means it can respond to both risk-aversion flows and manufacturing demand cycles simultaneously, making it more volatile than gold.
Round-number price levels in this range have repeatedly triggered measurable shifts in market behaviour and algorithmic activity throughout August 2026, acting as genuine psychological and technical reference points that influence short-term price momentum.


