
Saudi Aramco’s Exports Hold, but War-Risk Costs Tell a Darker Story
Aug 17, 2026


Copper treatment charges have reached -$175.7 per tonne as of August 2026, a record low that would have been dismissed as implausible five years ago. Smelters are now paying miners to take their concentrate. This is the 19th consecutive month of negative treatment charges, a streak that has reshaped how value is distributed across the copper supply chain. The condition is not a market anomaly awaiting correction; it reflects a structural concentrate shortage reinforced by documented output failures at several of the world’s largest copper operations. What follows is an analysis of what negative treatment charges mean in practice, why the condition has persisted so long, how supply disruptions at Codelco and Antofagasta are compounding the squeeze, and precisely where the margin is flowing for investors holding or evaluating copper producer equities.
The LME copper price is the figure most investors track. But between the mine and the market sits a less visible mechanism that determines how much of that price miners actually retain: treatment and refining charges (TC/RCs).
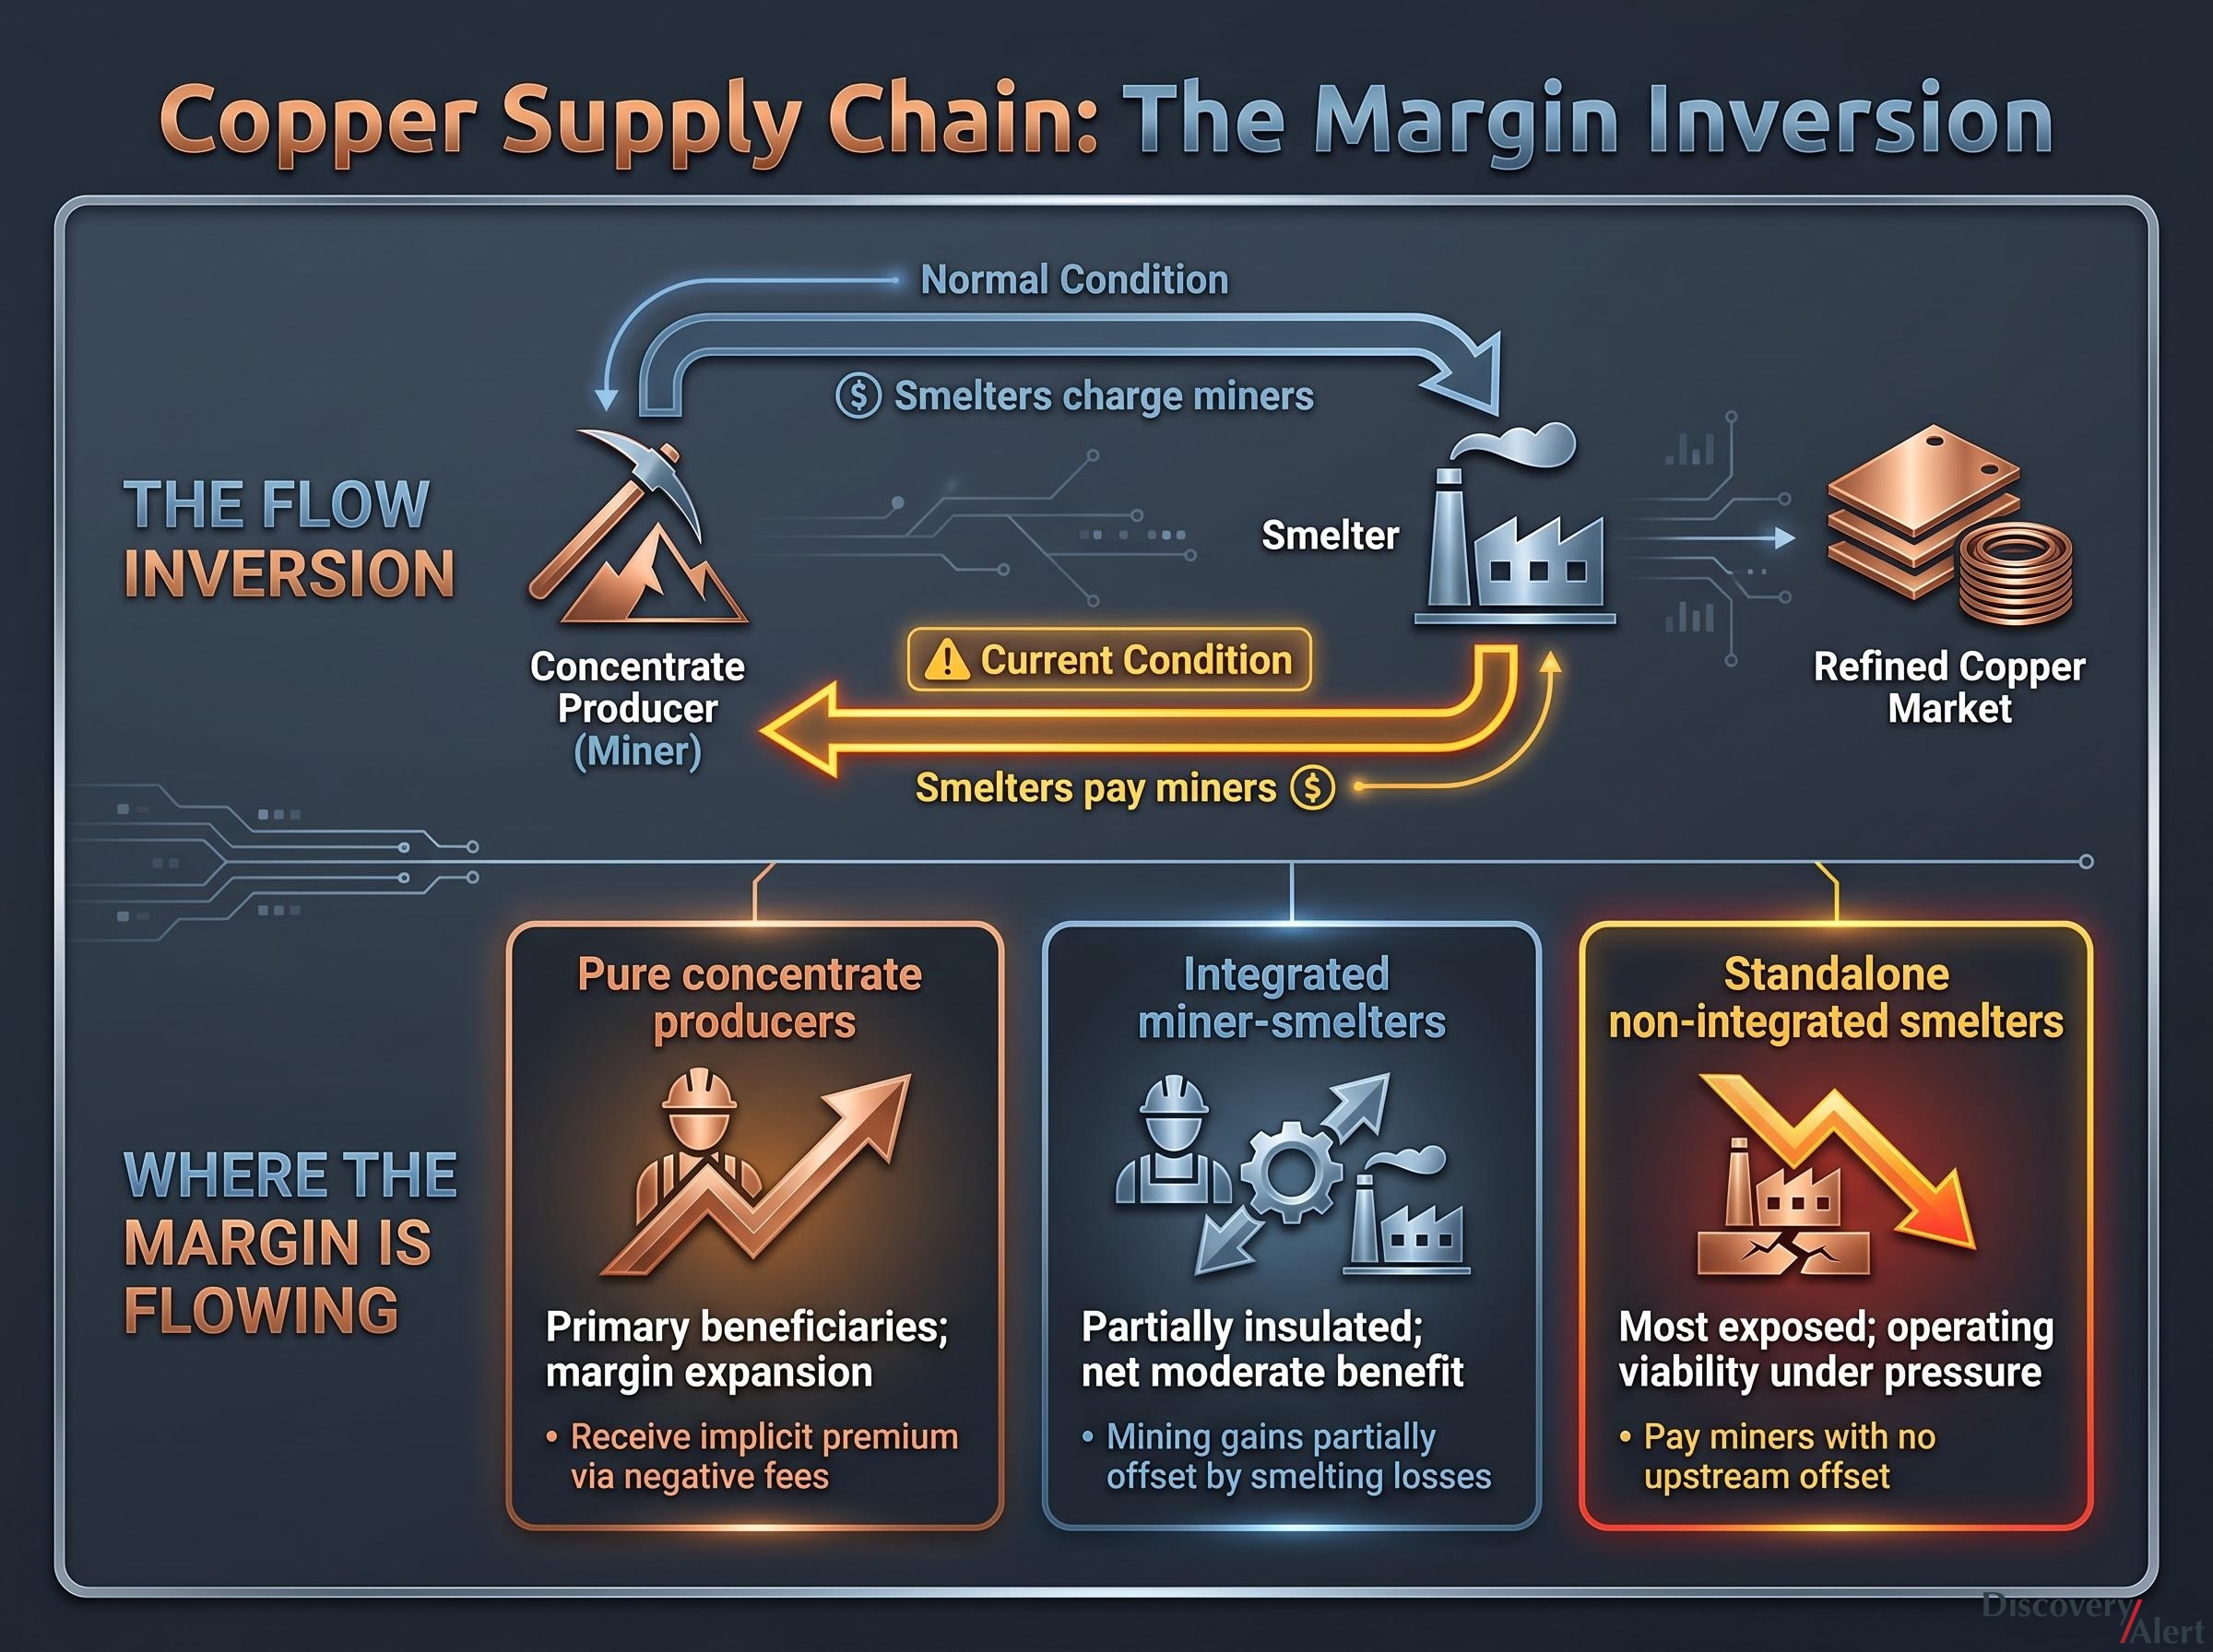
TC/RCs are the fees smelters charge miners to convert raw copper concentrate into refined metal. Treatment charges are quoted in dollars per dry metric tonne; refining charges are quoted in cents per pound of payable copper. Together, they function as the core bargaining outcome between feedstock suppliers and processors.
The three-party flow works as follows:
Under normal conditions, bargaining power shifts based on concentrate availability. When concentrate is plentiful, smelters negotiate higher fees. When concentrate is scarce, miners negotiate lower fees. As recently as 2024, the annual benchmark TC/RC sat at approximately $80/t, a level that reflected a market broadly in balance.
Negative TC/RCs mean the payment direction inverts entirely. Smelters pay miners to secure feedstock rather than charging miners to process it. Some smelters, according to industry reporting, are paying more for ore than the value they recover after refining. This represents a complete reversal of the economics that have governed the concentrate market for decades, and it is the condition that has persisted for 19 consecutive months.
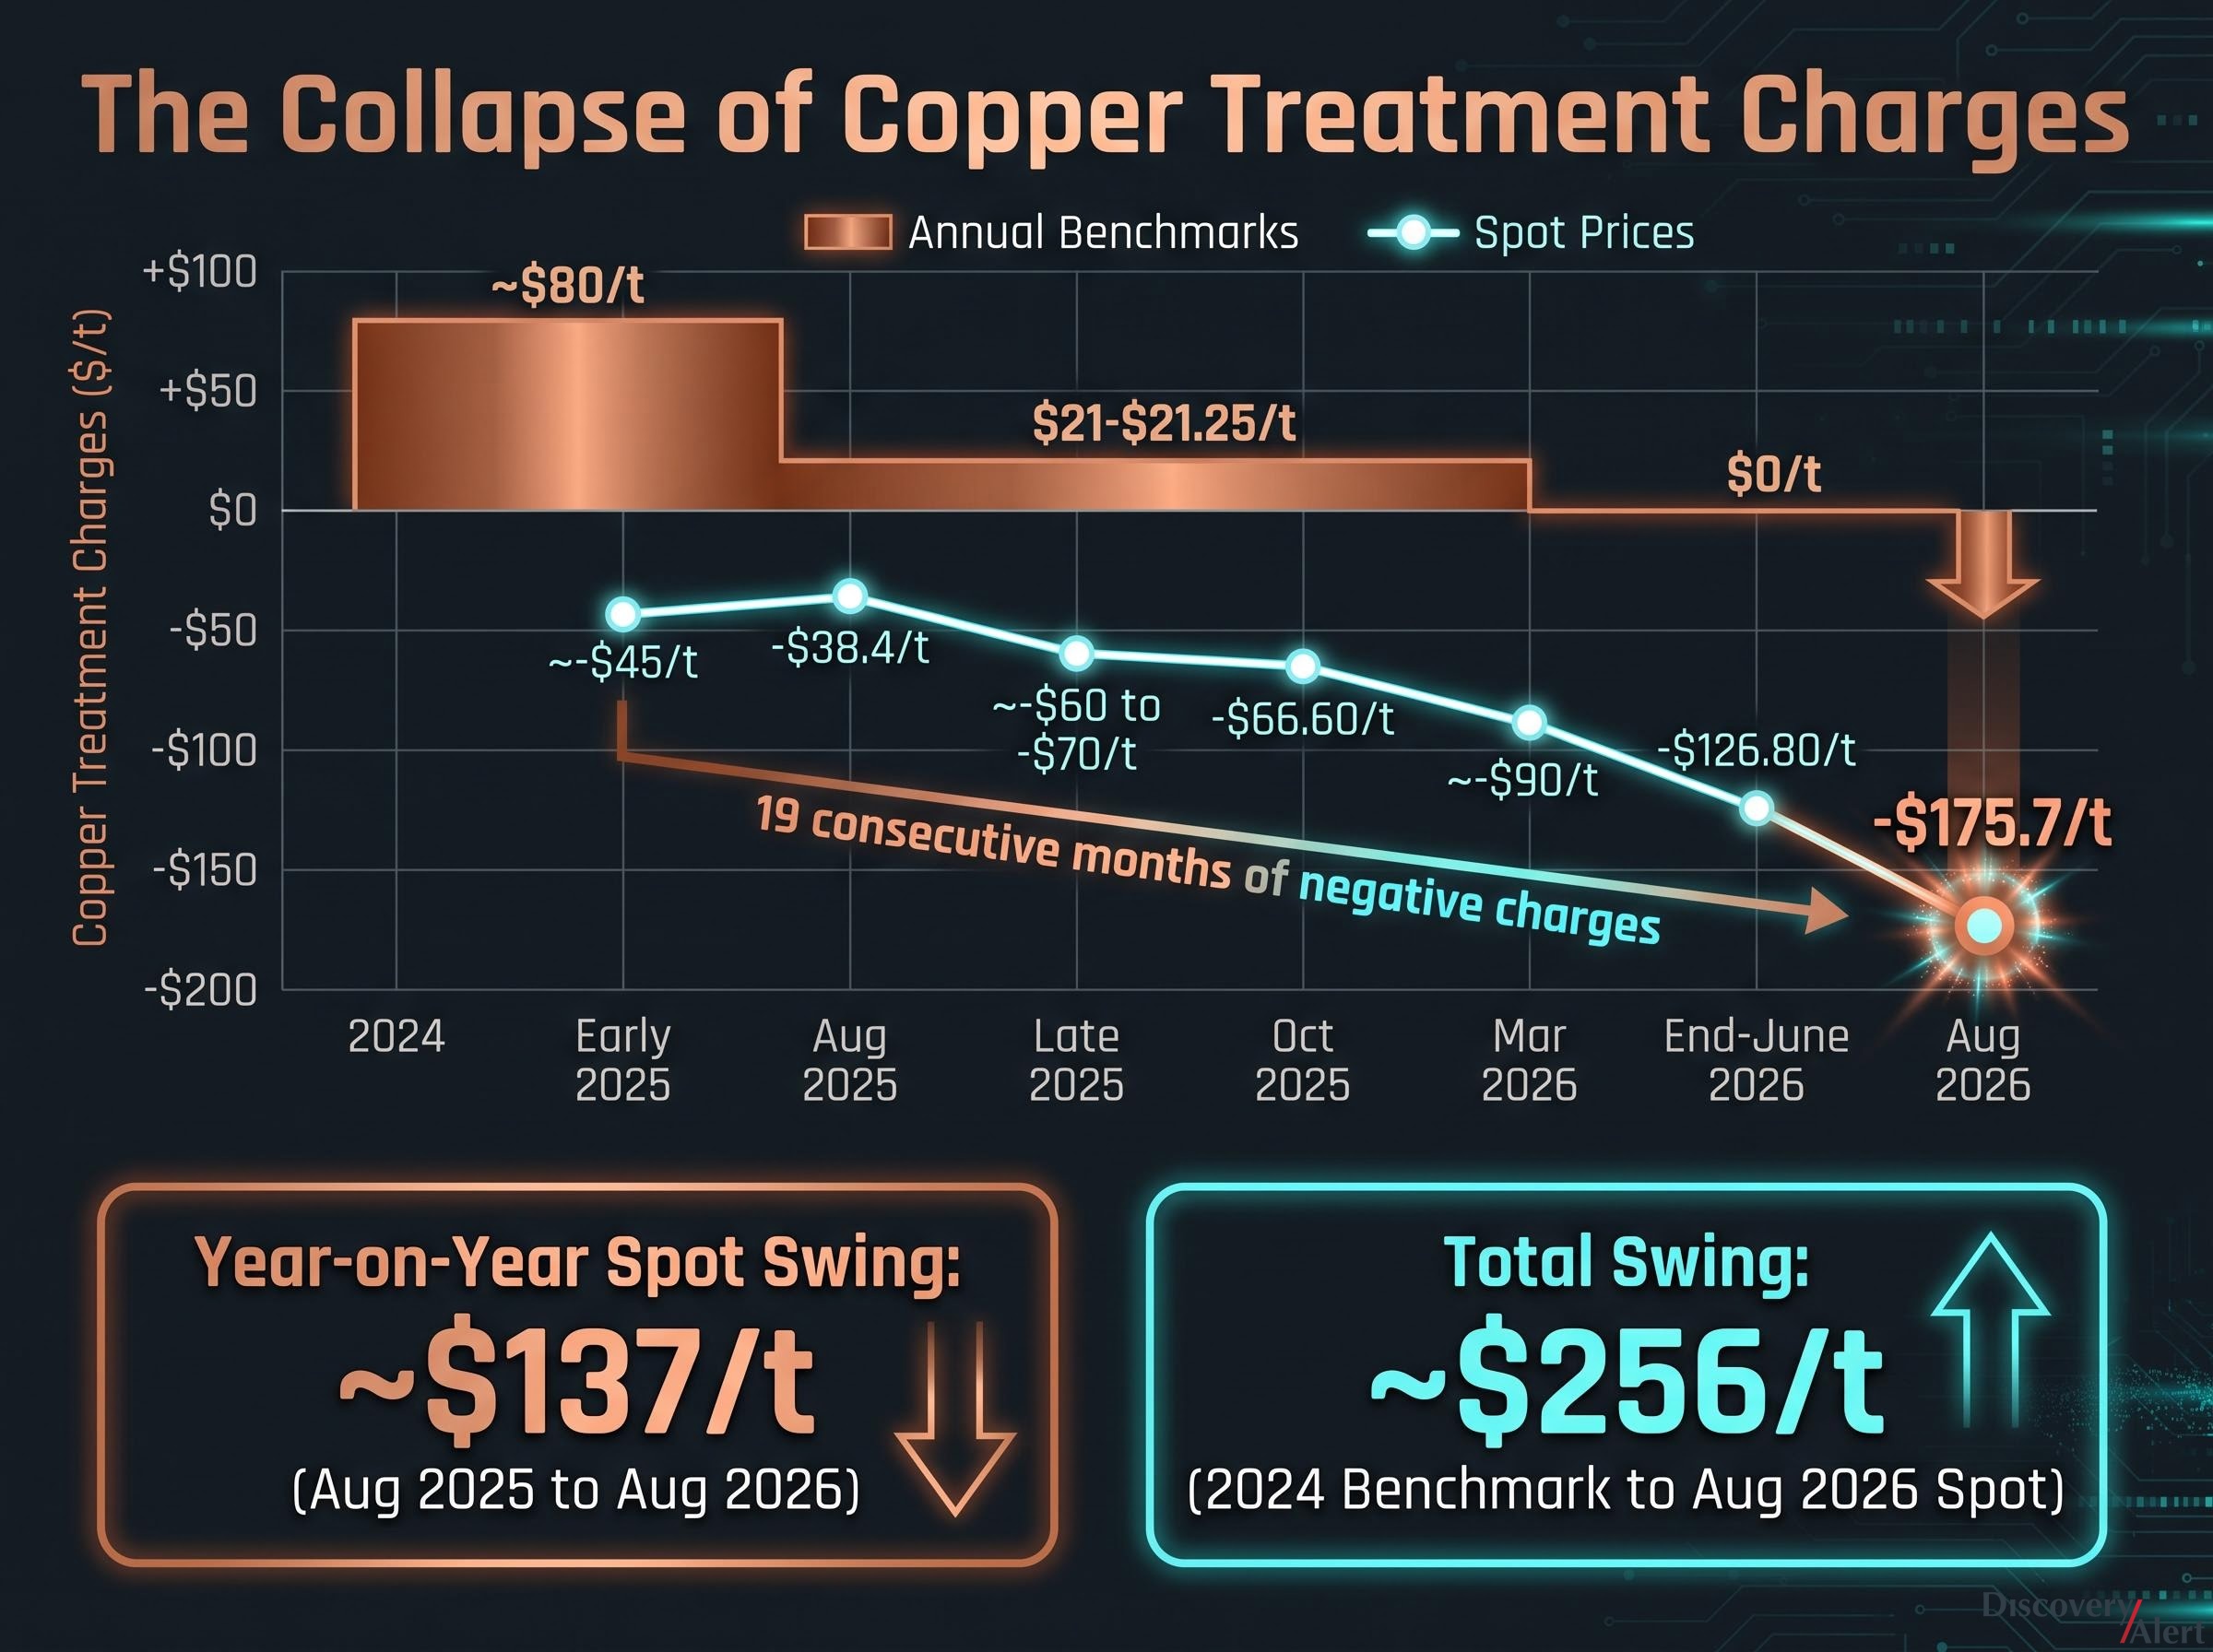
The collapse began in the annual benchmark contracts and then accelerated through the spot market, with each successive data point extending the deterioration rather than reversing it.
Annual benchmarks tell the structural story. The 2024 contract settled at approximately $80/t. The 2025 contract collapsed to $21-$21.25/t. The 2026 contract settled at $0/t, the first zero benchmark in the history of the copper concentrate market, institutionalising the structural shortage into full-year contractual terms.
The annual TC/RC benchmark trajectory from $80/t in 2024 to $21.25/t in 2025 and $0/t in 2026 reflects a shift driven by smelting capacity expansion outpacing mine production, a dynamic extensively documented in copper market analysis covering the structural mechanics of how these benchmarks are negotiated and set.
Spot TC/RCs tell the acute story. The SMM spot index began 2025 at approximately -$45/t and deteriorated to approximately -$60 to -$70/t by late 2025, with the Asia-Pacific index recording -$66.60/t in October 2025. By March 2026, spot readings had fallen to approximately -$90/t. By end of June 2026, the index reached -$126.80/t. According to Crux Investor analysis, the reading hit -$175.7/t in August 2026.
| Period | Type | Value ($/t) |
|---|---|---|
| 2024 | Benchmark | ~$80 |
| 2025 | Benchmark | $21-$21.25 |
| 2026 | Benchmark | $0 |
| Early 2025 | Spot | ~-$45 |
| Late 2025 | Spot | ~-$60 to -$70 |
| October 2025 | Spot (Asia-Pacific) | -$66.60 |
| March 2026 | Spot | ~-$90 |
| End-June 2026 | Spot | -$126.80 |
| August 2026 | Spot | -$175.7 |
The year-on-year acceleration is striking.
In August 2025, spot TC/RCs stood at -$38.4/t. Twelve months later, the same reading is -$175.7/t, a year-on-year swing of approximately $137/t in favour of concentrate producers.
Every dollar of the approximately $256/t swing from the 2024 benchmark to the current spot level has moved in one direction: away from smelters and toward miners.
The pricing data reflects a concentrate market under sustained physical stress. That stress traces to specific mines, specific companies, and specific failures to deliver.
Each of these disruptions is individually material. Together they represent a confluence of supply removal at exactly the moment smelting capacity was already outrunning feedstock availability.
The copper supply disruption drivers that built through 2025 did not emerge in isolation; aging asset profiles, labour disputes, and water access constraints at key Chilean and Congolese operations had already been compressing concentrate availability before the acute production failures at Grasberg and Kamoa-Kakula removed additional volume from a market with no slack.
The acute failures sit atop deeper secular constraints. Aging assets and grade decline at major established operations are reducing output trajectories before any disruption is factored in. Project delivery timelines remain slow, and limited new concentrate supply is coming online despite elevated copper prices that would normally incentivise development. Analysts have characterised the resulting imbalance as an “extreme misbalance between smelting capacity and concentrate production” and the “most extreme structural stress in decades.”
The structural copper supply deficit underpinning the TC/RC collapse extends well beyond individual mine disruptions; project timelines running 15-20 years from discovery to production mean that even a sustained high-price environment cannot rapidly close the gap between smelting capacity and concentrate availability.
China’s major smelters are not passively absorbing the negative TC/RC environment. They are making active operational decisions under duress, and those decisions are amplifying conditions downstream.
Top Chinese smelters have announced explicit output cuts in direct response to negative processing fees. Industry commentary describes the sector as operating under a “market and pricing crisis,” with spot TC/RCs at aggressively low levels for more than a year.
Industry analysts describe China’s smelter sector as operating under a “market and pricing crisis,” with some operators paying more for ore than the value recovered after refining.
The severity is not uniform. Integrated miner-smelters, those with their own mine output, are partially buffered because upstream mining gains offset downstream processing losses within the same entity. Standalone non-integrated smelters face the sharpest squeeze, with no upstream offset and direct exposure to negative economics on every tonne processed.
An additional constraint is limiting smelters’ ability to substitute away from primary concentrate: tighter enforcement of VAT invoice regulations is reducing the availability of VAT-compliant recycled copper, according to Crux Investor analysis, constraining an alternative feedstock source.
The chain of causation runs in one direction:
The copper inventory buffer sitting at global warehouses provides almost no shock absorption against supply disruptions of this magnitude; with roughly 15 days of consumption cover across exchange-monitored stocks, any sustained reduction in smelter utilisation translates almost immediately into physical tightness visible in spot premiums.
Smelter output cuts are not merely a symptom of the TC/RC crisis. They are a transmission mechanism that tightens the refined copper market, with implications for physical premiums and downstream pricing well beyond the concentrate segment.
For investors modelling copper producer equities, the TC/RC collapse changes the arithmetic of mine-level economics in ways that standard LME-price-linked models will not capture.
The core insight is this: when TC/RCs are negative, concentrate producers receive the payable metal value plus an implicit premium equal to the magnitude of the negative fee. LME copper price exposure alone materially understates mine-level returns.
The mechanism behind why copper miners outperform the metal during concentrate-constrained cycles is rooted in exactly this kind of TC/RC-driven margin expansion: mine-level returns grow faster than the LME price alone would suggest, because upstream pricing power compounds the commodity gain.
The margin transfer is quantifiable across three reference points. The annual benchmark swing from $80/t in 2024 to $0/t in 2026 represents an $80/t shift in economics favouring miners over the benchmark cycle. The spot trajectory from approximately -$60/t in late 2025 to at least -$126.80/t by mid-2026 implies an incremental spot margin tailwind of approximately $60-$70/t for concentrate producers during that period. The year-on-year swing of approximately $137/t as of August 2026 captures the full acceleration.
The benefits are not distributed evenly across the supply chain.
| Operator Type | TC/RC Impact | Net Position |
|---|---|---|
| Pure concentrate producers | Receive implicit premium via negative fees | Primary beneficiaries; margin expansion |
| Integrated miner-smelters | Mining gains partially offset by smelting losses | Partially insulated; net moderate benefit |
| Standalone non-integrated smelters | Pay miners to secure feedstock; no upstream offset | Most exposed; operating viability under pressure |
Experts expect TC/RCs “to remain low due to mine disruptions and a lack of additional feedstock,” according to industry analysis. The key variable to track is not just the copper price but the level of spot TC/RCs and the operational status of major concentrate producers.
The persistence case rests on documented constraints. Aging mines do not reverse grade decline. Slow project delivery does not accelerate in quarters; it operates on multi-year timelines. The specific operational disruptions at Codelco, Antofagasta, Grasberg, and Kamoa-Kakula are not the kind of production shortfalls that resolve quickly. This is a durable feature of mine-level economics rather than a transient anomaly.
The same concentrate tightness driving negative TC/RCs is compressing refined copper availability through smelter output cuts. The Yangshan premium, the premium for copper delivered physically into China, serves as a downstream monitoring signal for this transmission effect. Reduced smelter utilisation translates directly to reduced refined copper production, and in the context of strong demand from electrification and grid investment, that constraint amplifies physical market tightness.
The 2026 annual benchmark at $0/t is evidence that the structural condition has already been institutionalised into contractual terms for the full year. Antofagasta’s revised 2026 guidance and Codelco’s abandoned production target are forward indicators that concentrate supply is not recovering in the near term.
For copper equity investors, three forward indicators are worth monitoring:
The 19-month negative streak and the -$175.7/t record are not the endpoint. They are evidence that the structural misbalance between smelting capacity and concentrate production has not yet found its resolution. For mine-level operators, pricing power sits firmly upstream, and it is likely to remain there until new concentrate supply closes the structural gap.
This article is for informational purposes only and should not be considered financial advice. Investors should conduct their own research and consult with financial professionals before making investment decisions. Past performance does not guarantee future results. Forward-looking statements regarding TC/RC levels and production targets are subject to change based on market developments and operational performance.
Copper treatment charges (TC/RCs) are fees smelters charge miners to convert raw copper concentrate into refined metal, quoted in dollars per dry metric tonne. When concentrate is scarce, bargaining power shifts to miners and charges fall; when charges turn negative, smelters actually pay miners to secure feedstock rather than charging them for processing.
Copper treatment charges turned negative because smelting capacity has expanded faster than mine production can supply concentrate, a structural imbalance compounded by specific output failures at major operations including Codelco, Antofagasta's Los Pelambres, Grasberg, and Kamoa-Kakula. The 2026 annual benchmark settled at $0 per tonne, the first zero benchmark in the market's history, institutionalising the shortage into full-year contractual terms.
When treatment charges are negative, concentrate producers receive the full payable metal value plus an implicit premium equal to the magnitude of the negative fee, meaning mine-level returns grow faster than the LME copper price alone would suggest. Pure concentrate producers are the primary beneficiaries, while standalone non-integrated smelters face the sharpest squeeze with no upstream offset.
As of August 2026, copper treatment charges have been negative for 19 consecutive months, with the spot index deteriorating from approximately -$45 per tonne in early 2025 to a record -$175.7 per tonne in August 2026, a year-on-year swing of roughly $137 per tonne in favour of concentrate producers.
Investors should track three forward indicators: the SMM spot TC/RC index as the primary signal of pricing power between miners and smelters, the Yangshan premium as a downstream signal of physical copper tightness from smelter output cuts, and operational production updates from major concentrate producers including Codelco, Antofagasta, Grasberg, and Kamoa-Kakula.


