
Saudi Aramco’s Exports Hold, but War-Risk Costs Tell a Darker Story
Aug 17, 2026


Gold hit $4,138 intraday on July 31, then immediately started pulling back. For precious metals investors, the question is not whether that move was real. It is whether the retreat signals a structural reversal or simply the market digesting a technically driven spike. Two forces drove the late-July run: speculative positioning ahead of the August futures expiration and a cluster of macro anxieties around equity overvaluation and political tension. Both have now partially resolved. The August-to-December contract roll is largely complete, and open interest data show the market is less leveraged today than it was in January. That changes the near-term calculus. What follows unpacks what COMEX open interest and inventory data actually show, separates mechanics from mythology on warehouse stocks, and maps out a three-horizon view of gold prices from August through year-end 2026, giving investors a grounded basis for deciding whether to act on the pullback or wait.
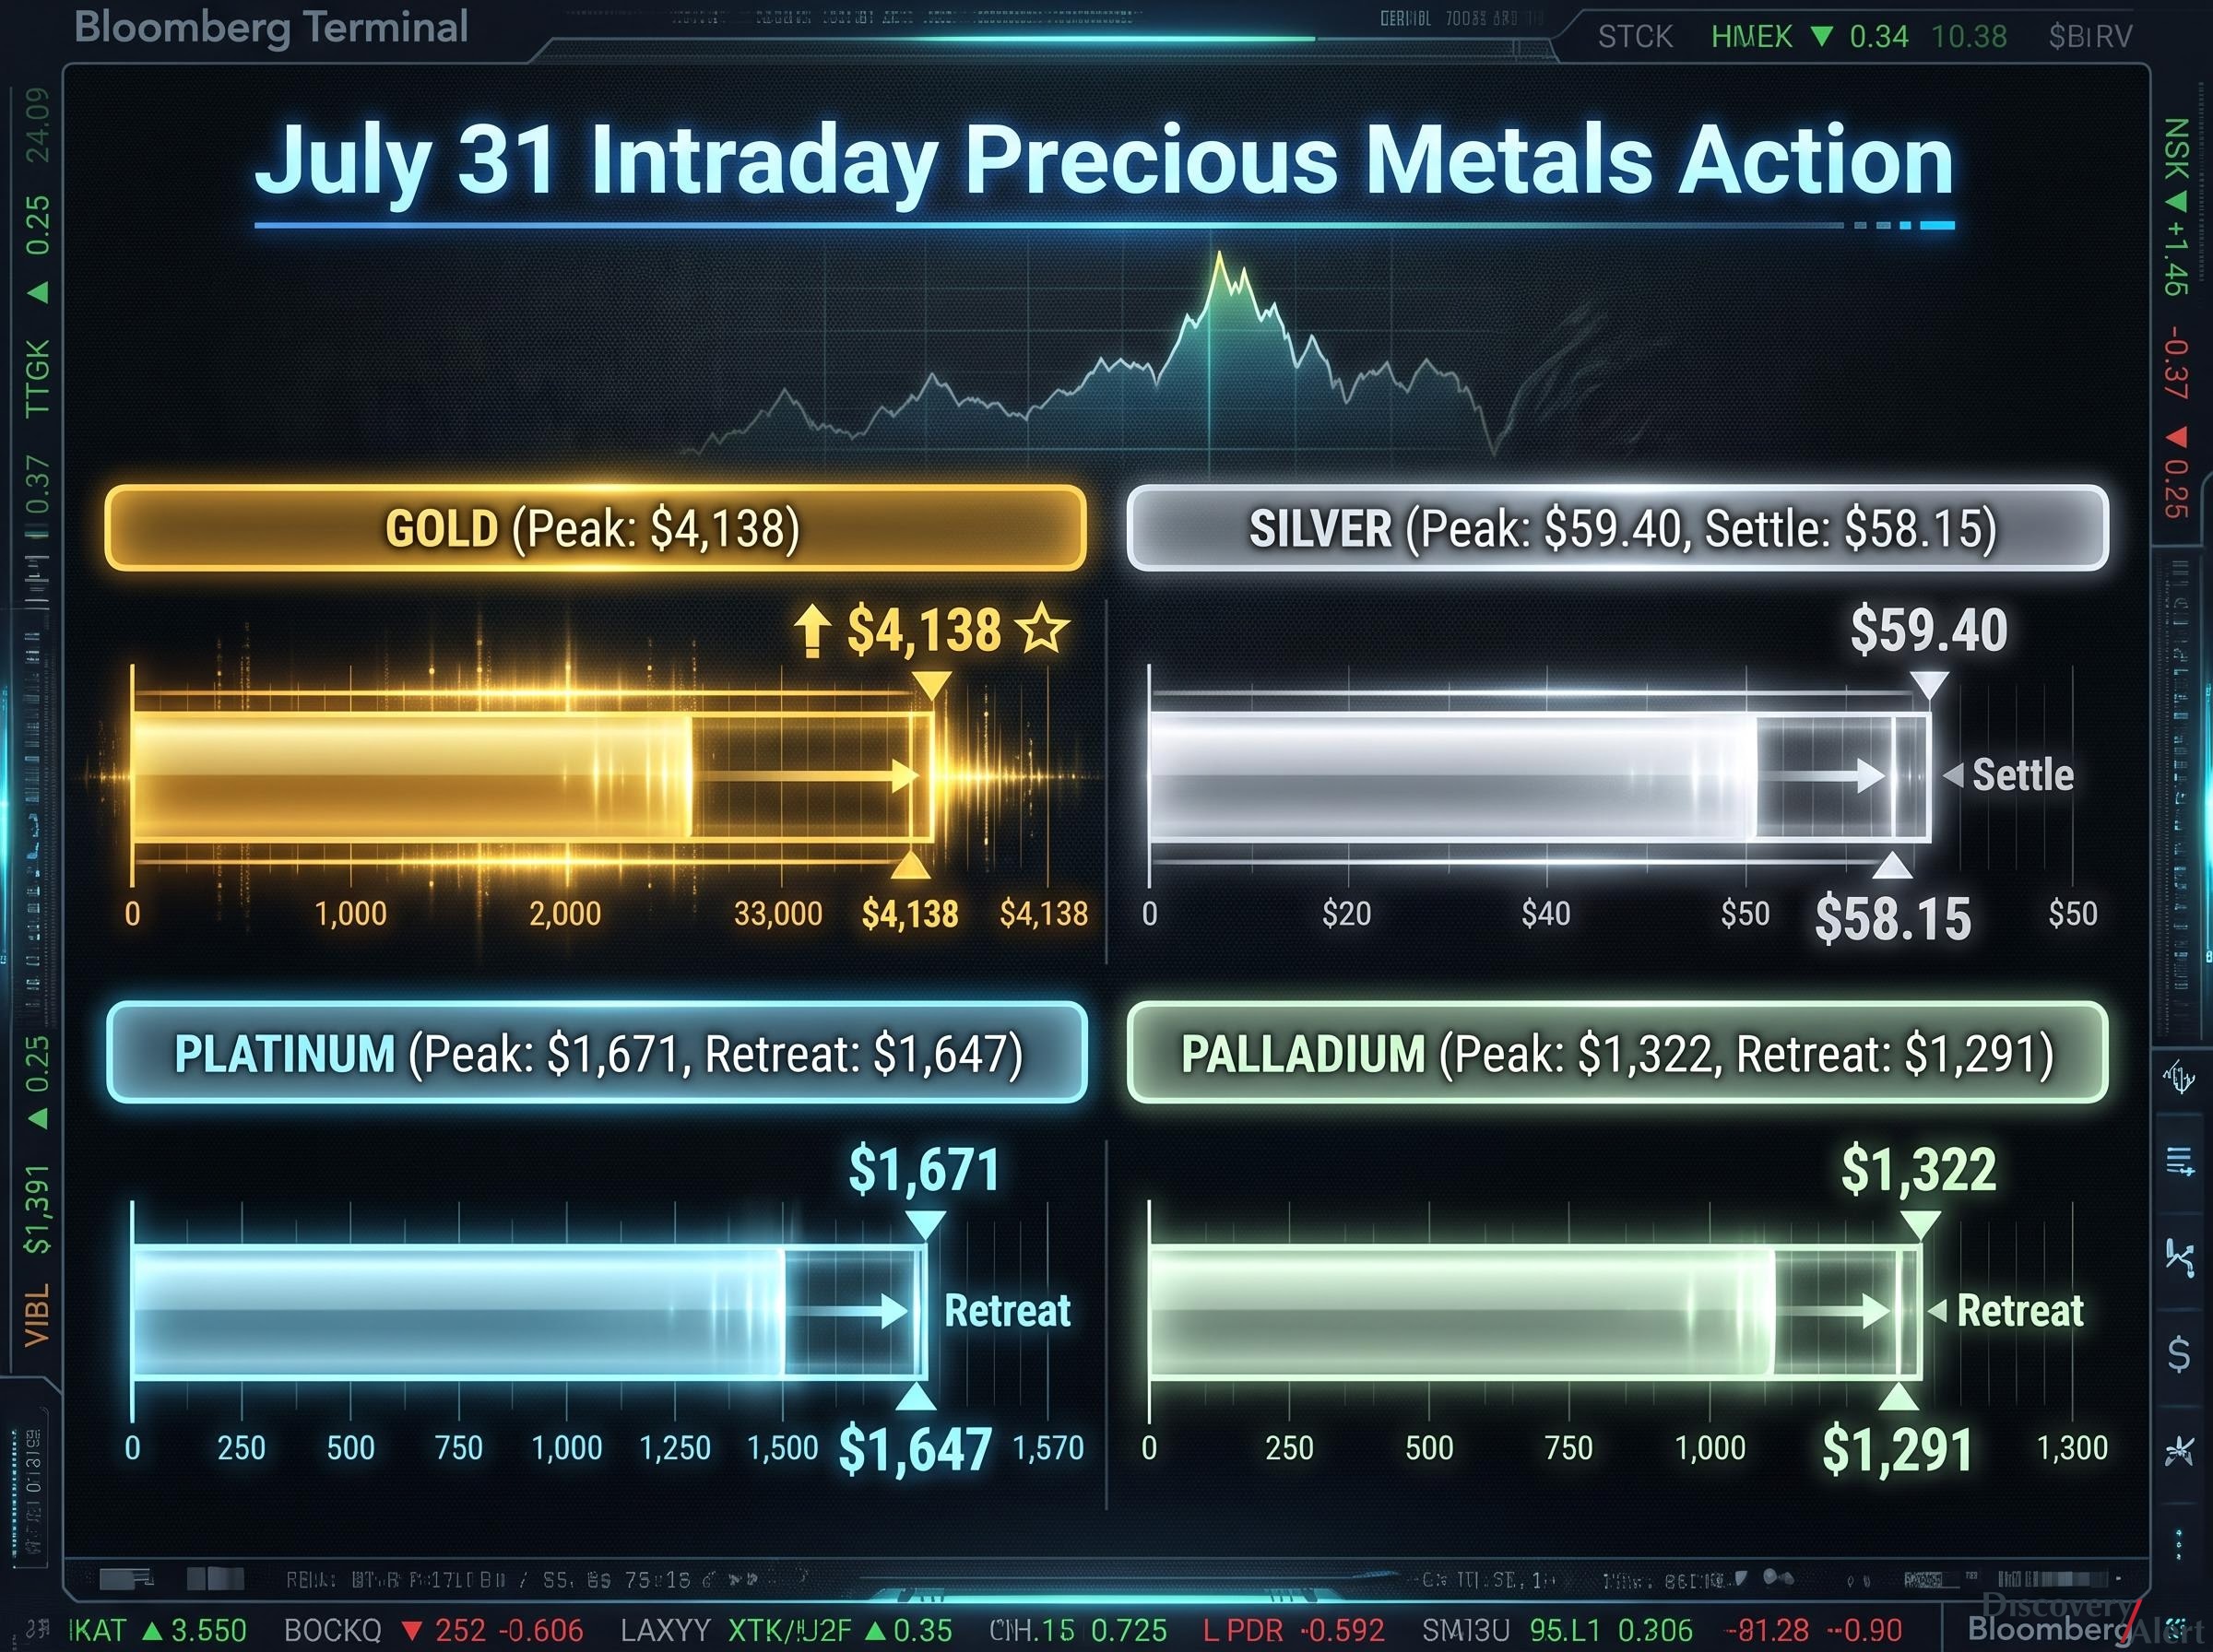
Gold was trading at approximately $4,080 at around 8:10 AM on July 31 before pushing to an intraday high of $4,138, according to CPM Group’s Jeffrey Christian. CME exchange data for the same session recorded a slightly different peak of $4,118; the discrepancy likely reflects differing timestamp conventions, but both figures confirm the session printed the highest gold price on record.
Intraday Record: Gold reached $4,138 on July 31 2026, per CPM Group’s Jeffrey Christian, marking the session’s peak before a sharp retreat into the close.
The spike was not a single-catalyst event. It was a convergence of short-term forces arriving simultaneously:
The broader precious metals complex confirmed the momentum. Silver reached $59.40 before settling at $58.15, platinum touched $1,671 before falling to $1,647, and palladium hit $1,322 before retreating to $1,291.
With the August roll now complete and no new macro shock on the immediate horizon, the market has lost one of those mechanical supports. What remains is a digestion phase, and investors who see only the headline price without understanding what produced it risk misreading the setup entirely.
Futures contract rolls are one of the least understood forces in gold pricing. When traders hold positions in an expiring front-month contract, they must close those positions or roll them into a later-dated contract before first-notice day. That rolling activity mechanically adds buying interest to the deferred month, creating short-term price support that disappears once the process is finished.
The scale of the August 2026 roll was substantial. Open interest data from CME Group show the transfer clearly:
| Contract Month | OI at Start of July | OI at End of July | Role |
|---|---|---|---|
| August 2026 | 275,014 contracts (~27.5M oz) | 26,763 contracts (~2.7M oz) | Expiring |
| October 2026 | ~5M oz | ~5M oz | Watch (late September) |
| December 2026 | — | ~27.6M oz | Dominant |
Approximately 25 million ounces of futures interest migrated from August into deferred months over the course of July. December now holds roughly 27.6 million ounces of open interest and is the dominant contract, according to CPM Group data as of July 30.
The roll-driven buying into December is now exhausted. Future price direction in back months depends on fresh directional positioning rather than calendar mechanics.
The October contract, carrying roughly 5 million ounces of open interest, will generate its own roll flows in late September. Given its materially smaller scale compared to August’s 27.5 million ounces, that event warrants monitoring as a tactical volatility catalyst, not a structural one.
Few topics generate more anxiety on financial social media than COMEX warehouse stocks. Claims of imminent depletion and hidden encumbrances circulate routinely, and they routinely misread how the system actually works. The data tell a calmer story.
As of July 30, total COMEX gold inventories stood at approximately 27.0 million ounces, down from roughly 27.6 million ounces at end of June. That net outflow of approximately 0.5 million ounces is immaterial relative to total holdings.
| Category | July 30 Figure | Definition | Deliverable Against Futures? |
|---|---|---|---|
| Registered | ~14.7M oz | Metal meeting specifications and carrying a valid warrant for delivery | Yes |
| Eligible | ~12M oz (end-June baseline) | Metal meeting specifications but not currently warranted for delivery | No (must be registered first) |
| Pledged | ~1.8M oz | Metal held in COMEX vaults but encumbered by ETF or other claims | No |
Two misconceptions deserve direct correction. First, registered metal cannot simply be withdrawn from a depository. It must first be moved to eligible status before removal, a deliberate action by the warrant holder. Second, ETF-pledged gold is not embedded inside registered inventory figures. Pledged ounces are a distinct, separately reported category that sits entirely outside registered and eligible totals.
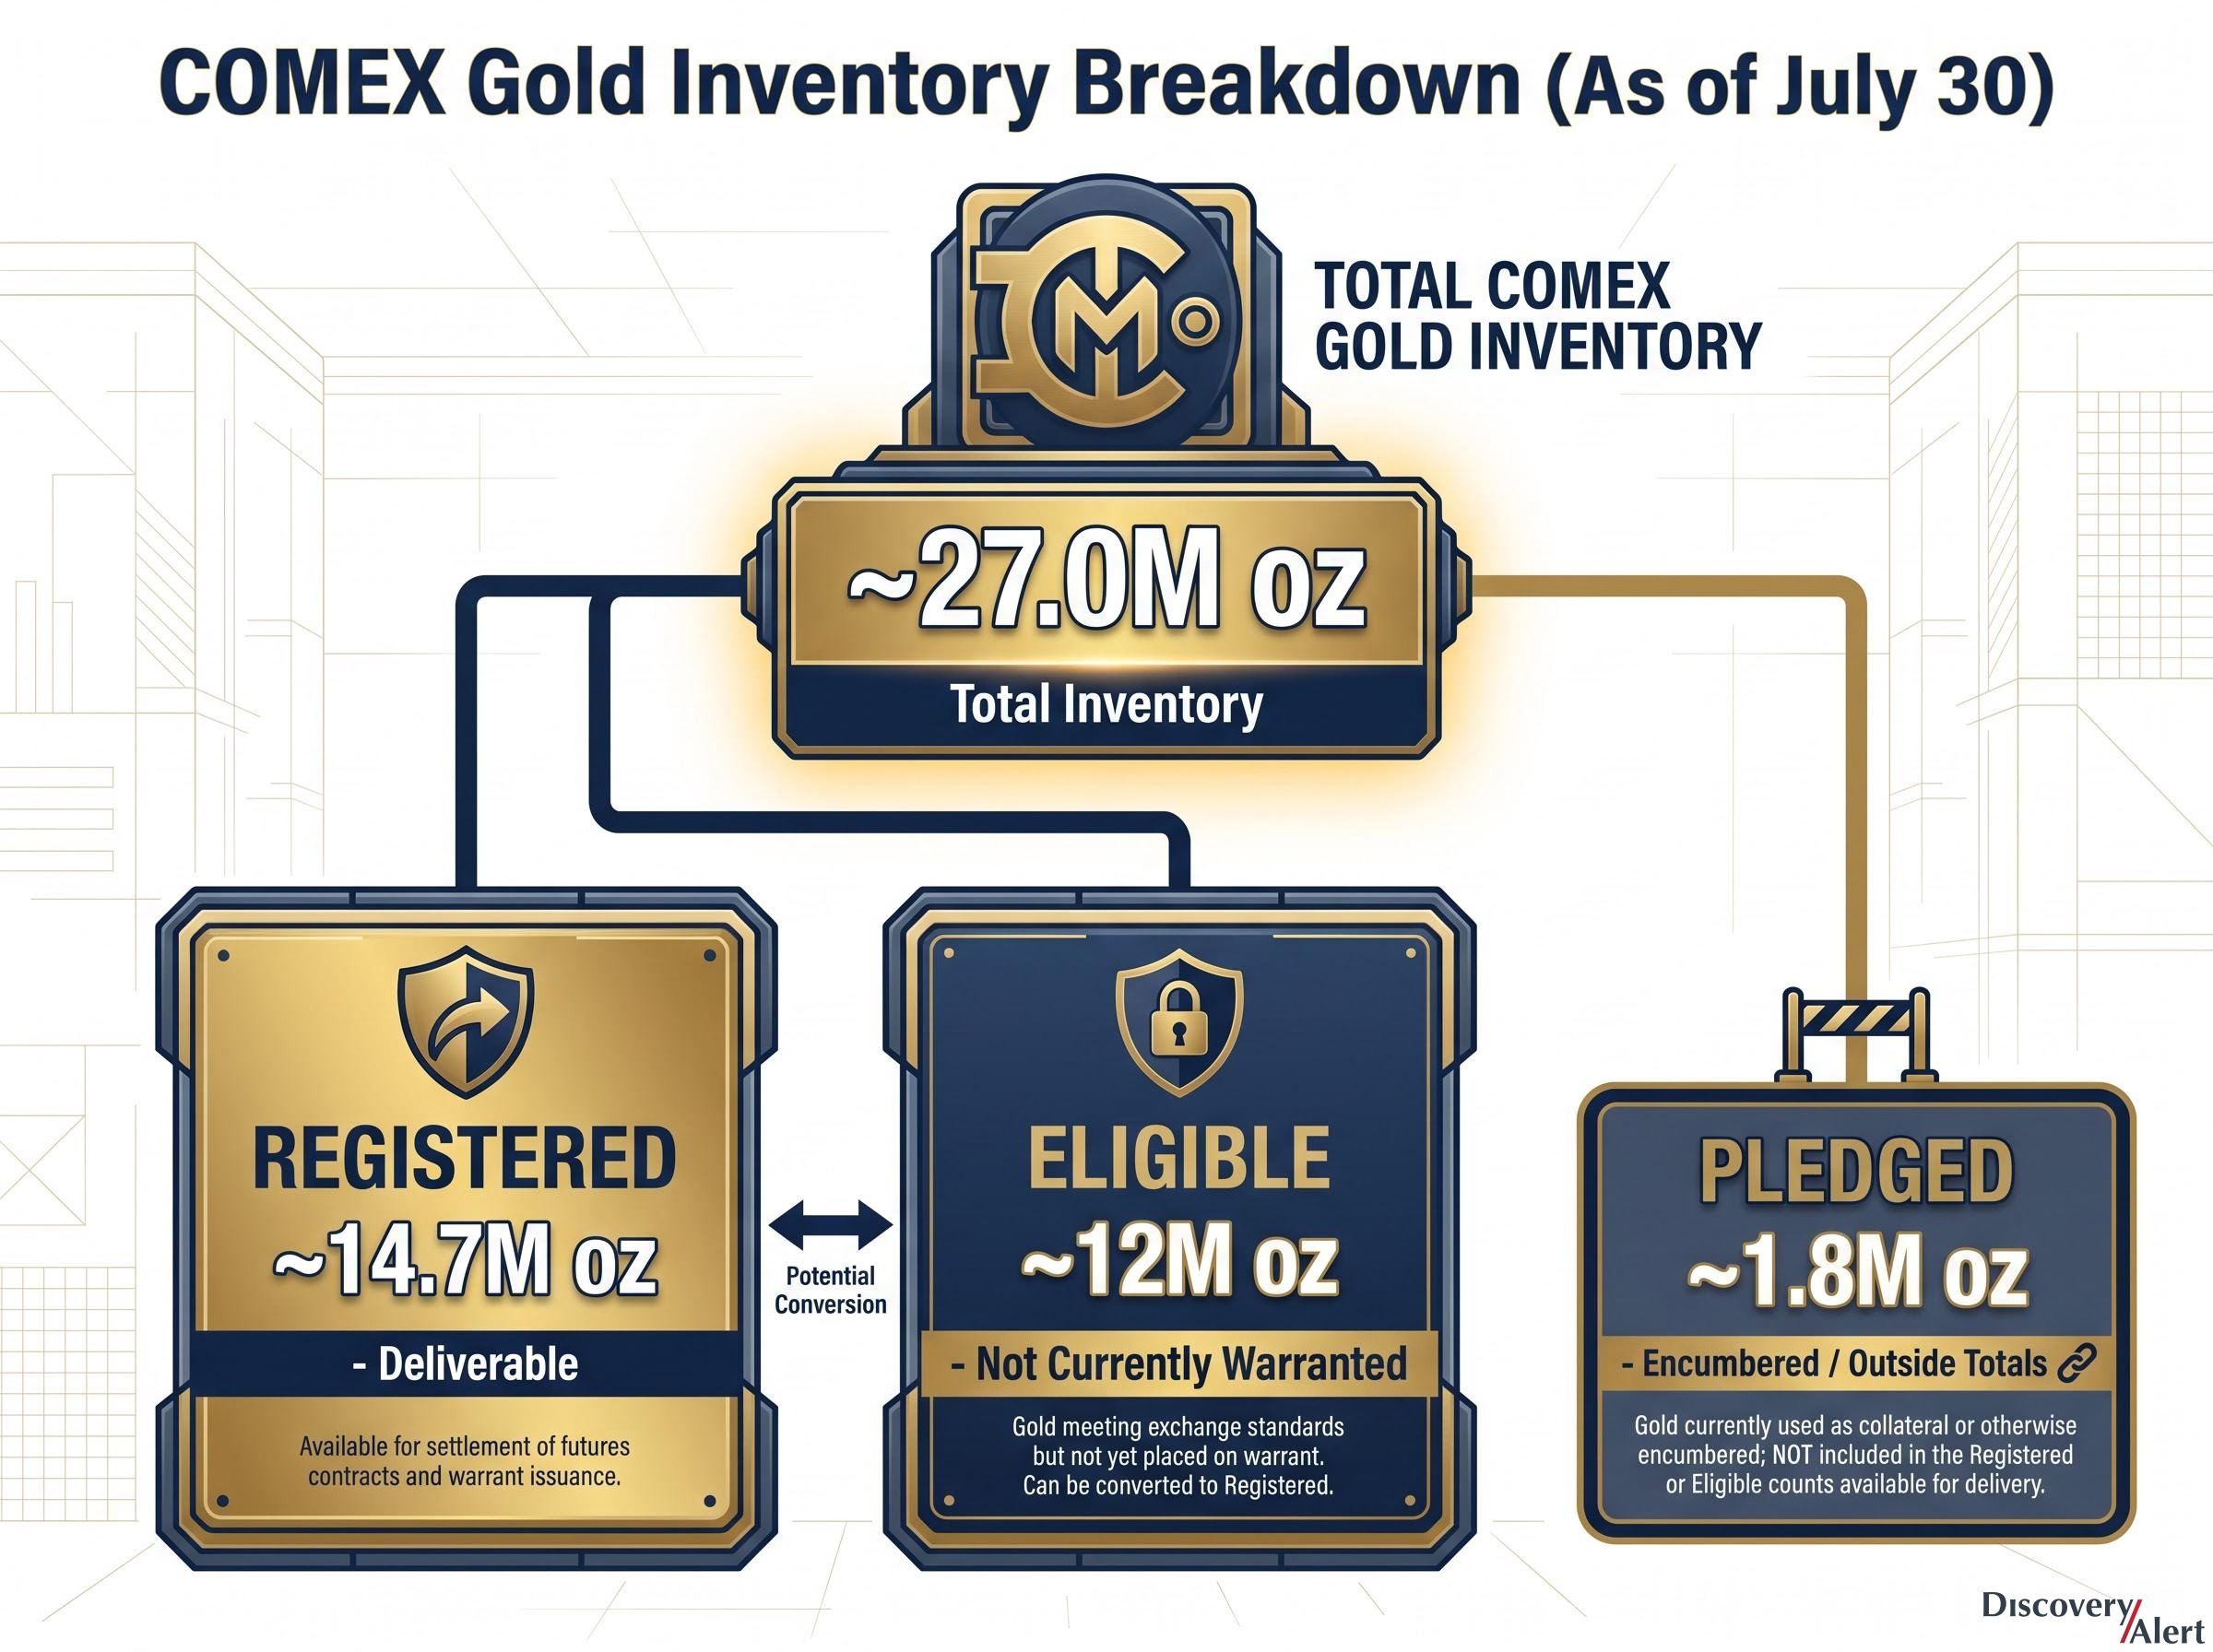
Key distinction: The 1.8 million ounces of pledged inventory as of July 30 are stored in COMEX-approved vaults but are not counted as registered deliverable stock. They sit outside both registered and eligible totals.
Delivery activity corroborates a system functioning normally. Arc Research’s mid-July warehouse report noted 11,606 gold contracts delivered month-to-date through July 15, indicating persistent demand for physical settlement. The combination of steady inventories, stable registered stocks, and healthy deliveries points to no evidence of acute shortage.
The divergence between ETF outflows and central bank accumulation running simultaneously through mid-2026 illustrates why aggregate gold demand figures can mislead: retail and institutional selling in Western paper markets has been offset by persistent official sector physical buying at a scale that dwarfs the ETF category.
Total COMEX gold open interest presents a data picture that requires careful sourcing. CPM Group reported approximately 38 million ounces as of July 30; CME data accessed in early August suggest approximately 49 million ounces (roughly 490,000 contracts). The discrepancy likely reflects different snapshot dates and reporting methodologies. Both figures sit well below the January 2026 peak above 527,000 contracts.
That decline is the important signal. The World Gold Council’s mid-July monitor noted that since mid-January, COMEX open interest had fallen by more than 1,000 tonnes (over 32 million ounces) to levels not seen since 2009. The speculative froth that built through late 2025 and into January was flushed out when gold dipped below its 200-day moving average.
The World Gold Council’s weekly markets monitor published in mid-July confirmed that COMEX open interest had fallen by more than 1,000 tonnes since mid-January to levels not seen since 2009, providing independent corroboration that the speculative excess accumulated through late 2025 had been substantially cleared before the July 31 spike.
The interpretive framework follows a sequential logic:
Declining OI during a price rally is typically a warning sign, suggesting shorts are covering rather than new longs entering. The current situation is different. OI declined from a historic peak during a price correction, which represents genuine deleveraging rather than exhaustion of bullish conviction.
The practical implication is that speculative length has room to grow from current levels. A market that has flushed its excess leverage and is rebuilding positioning from a low base is structurally less fragile than one carrying peak speculative load. That is paradoxically a reason for measured optimism heading into the final months of the year.
| Time Horizon | Expected Price Tone | Key Driver | Investor Implication |
|---|---|---|---|
| August (first 2-3 weeks) | Softening / sideways | Roll completion, post-spike digestion, no fresh macro catalyst | Patience; avoid chasing the prior high |
| September-October | Tactical volatility | October contract roll (~5M oz), smaller scale than August | Potential short-term entry point; monitor for dip |
| Q4 2026 | Recovery / firm tone | Normalised leverage, intact physical demand, no inventory stress | Structural case supports year-end strength if macro holds |
The near-term picture is straightforward. With the August roll complete and no obvious new macro shock, Jeffrey Christian and CPM Group expect softening or sideways trade through the first two to three weeks of August. The market is digesting a fast move toward $4,100-$4,138 and has lost a mechanical source of support.
The October roll in late September represents a tactical event rather than a structural one. Its comparatively small open interest base of approximately 5 million ounces means any roll-related volatility should be modest, but it may offer a short-term trading opportunity for investors watching for an entry.
Year-end outlook: CPM Group’s Jeffrey Christian sees a price recovery through the final four months of 2026, describing a pattern that resembles the price behaviour previously observed for gold and silver earlier in the year.
The structural supports for that view are specific: speculative length has room to grow, delivery activity through mid-July was robust, registered stocks are holding, and the post-flush market is less leveraged than it was in January. That combination is consistent with a market capable of supporting a renewed advance, provided the macro backdrop of rates, geopolitics, and equity valuations stays broadly supportive through Q3.
The current pullback from the July 31 highs is a post-mechanical-event digestion, not a fundamental deterioration. A genuine structural top would look different: significantly elevated open interest, inventory stress, and a macro regime shift. None of those conditions are present.
The broader consensus among commodity analysts treating this as a digestion phase rather than a trend reversal is grounded in the same structural evidence that frames gold’s 2026 bull market as a pause driven by mechanical roll completion and leverage flushing rather than a fundamental shift in the demand picture.
Three signals warrant close monitoring in the weeks ahead:
The conditions that would invalidate the year-end recovery thesis are equally specific:
If the macro backdrop stays broadly supportive through Q3, the structural case for Q4 strength remains intact. If a new shock materialises, the thesis should be revisited at that point rather than abandoned preemptively.
This article is for informational purposes only and should not be considered financial advice. Investors should conduct their own research and consult with financial professionals before making investment decisions. Past performance does not guarantee future results. Financial projections are subject to market conditions and various risk factors.
The July 31 spike was a confluence of roll mechanics and macro sentiment. The roll is done. What follows depends on whether fresh directional demand arrives to replace calendar-driven support.
The inventory picture serves as a stability anchor: no acute shortage, no systemic encumbrance issues, registered stocks holding at 14.7 million ounces, and delivery activity robust through mid-July. The speculative landscape, stripped of its January excess, is less fragile and structurally capable of supporting renewed positioning.
CPM Group’s Jeffrey Christian sees a recovery through Q4 if the macro backdrop holds. The COMEX data, read correctly, do not contradict that view. They describe a market that has digested a fast move, shed its excess leverage, and is waiting for the next directional catalyst.
For investors tracking whether that thesis develops as expected, two data sources matter most: the weekly CFTC Commitments of Traders reports for positioning shifts, and the daily COMEX depository reports for registered inventory movements. The mechanics are visible. The question is what the market decides to do with them.
With price discovery shifting east as Shanghai futures volumes and physical settlement activity grow relative to COMEX, the weekly CFTC Commitments of Traders report captures a progressively smaller share of total global positioning, a structural evolution that investors relying solely on Western open interest data as a sentiment gauge should account for.
COMEX open interest measures the total number of outstanding futures contracts that have not been settled, serving as a key sentiment gauge for gold; a declining open interest from a historic peak, as seen in early 2026, signals genuine deleveraging rather than exhaustion of bullish conviction.
The July 31 spike to $4,138 was a convergence of short-term forces including safe-haven demand from political tensions, equity overvaluation concerns, margin-call-driven liquidation flows, and mechanical buying tied to the August-to-December futures contract roll.
Registered gold meets COMEX specifications and carries a valid warrant, making it directly deliverable against futures contracts, while eligible gold meets specifications but is not currently warranted for delivery and must be converted to registered status before it can be used for settlement.
The August-to-December futures roll transferred approximately 25 million ounces of open interest into deferred months, providing mechanical price support through July; with that roll now complete, CPM Group expects softening or sideways gold price action through the first two to three weeks of August.
Investors should monitor total COMEX open interest recovering toward the January 2026 peak above 527,000 contracts, registered inventory remaining stable near 14.7 million ounces, and any short-term price dip around the October contract roll in late September as a potential tactical entry point.


